
Academic Research To Support Value Investing
Value investing is the technique of attempting to buy stocks that are trading at discounts to their intrinsic value. After purchasing undervalued stocks, value investors wait patiently for the market to fully appreciate the stock, allowing it to rise in price.
“Prices fluctuate more than values – so therein lies opportunity.”
Value investing underpins much of the work we do at Sure Dividend.
Our quantitative ranking system – The 8 Rules of Dividend Investing – is heavily dependent on stock prices. All else being equal, a declining stock price will help a company in our investment universe to rank higher using the 8 Rules.
Why do we rely on value investing principles to make buy or sell decisions?
Simply put, value investing works. And there’s evidence to prove it.
Warren Buffett, the world’s most successful investor who manages Berkshire Hathaway’s investment portfolio, is a devoted value investor and often educates the public on the principles of value investing through Berkshire Hathaway’s annual reports.
Buffett – a value investor – has averaged ~20% returns for decades.
Aside from the anecdotal evidence of Warren Buffett’s fantastic investment returns, there is also plenty of academic evidence to show that value investing works.
This article will summarize some of the most insightful academic research on value investing by outlining the results of various studies performed by leading finance academics.
Value Investing Evidence #1: The Value Quintile Outperforms
Carbon Beach Asset Management Inc. is a Santa Monica, California-based registered investment advisor (RIA) firm that caters to accredited investors.
Back in 2014, the firm’s managing partner, Tobias Carlisle, delivered an insightful presentation to Google employees, where he summarized research on the outperformance of stocks with cheap valuations.
More specifically, Carlisle’s firm ranked a global universe of ~22,000 stocks based on average percentiles of price-to-book, price-to-earnings, and price-to-cash-flow ratios and measured their historical performance over very long periods of time (from 1980 to 2013).
The results of this historical research can be seen below.

Source: Carbon Beach Asset Management (called Eyquem Investment Management at the time of the presentation)
The glamour quintile – the 20% of stocks with the highest valuations – had the poorest performance. From there, the valuation quintiles progressed linearly, with the value quintile delivering the strongest performance.
This research shows that undervalued stocks tend to outperform the market, evidence that value investing can deliver alpha for investors.
Furthermore, this research was conducted on a global universe of ~22,000 stocks, which indicates that value investing is widely applicable across a wide variety of geographies and stock market sectors.
Value Investing Evidence #2: The Value DecileOutperforms
Building on the data in the last section, which showed that the value quintile – the cheapest 20% of stocks – tends to outperform the broader market, this section will provide evidence that the value decile – the cheapest 10% of stocks – also outperforms.
Josef Lakonishok, Andrei Shleifer, and Robert Vishny published “Contrarian Investment, Extrapolation, and Risk” in 1994, a fascinating study that drew many conclusions on value investing.
More particularly, the group’s research performed a statistical analysis of historical stock market performance relative to valuations.
The paper constructed hypothetical portfolios at the end of each April between 1968 and 1989 based on valuation deciles using the price-to-book, price-to-cash-flow, and price-to-earnings metrics.
After constructing said model portfolios, the authors then computed cumulative total returns for the 5 years following portfolio construction.
Data on the performance of each valuation decile can be seen below.


Source: Contrarian Investment, Extrapolation, and Risk
Note that the authors used the inverse of traditional valuation metrics. So, instead of the price-to-earnings ratio, they used the earnings-to-price ratio. The glamor decile is accordingly the 1st decile of stocks instead of the 10th decile of stocks.
While is can be difficult to see in the table above, the value decile outperforms. The following chart provides a visual summary of this trend using the same data.

Source: Contrarian Investment, Extrapolation, and Risk; chart created by author. Valuation deciles have been inverted to reflect the other research published in this article. In this chart, the 1st decile is the value decile and the 10th decile is the glamor decile.
In this study, the value decile outperforms. This supports the first study summarized in this analysis and affirms our belief that stocks with cheap valuations outperform the market (on average).
Value Investing Evidence #3: Value Stocks Grow Their Earnings Faster Than Glamor Stocks
There are only three ways for a stock to generate investment returns:
- Dividend payments
- Valuation changes
- Growth in earnings-per-share (or book value, or other measures of intrinsic value)
One would think that the major source of investment returns for value stocks is valuation changes. Namely, investors are rewarded as valuation multiples are revised upwards and stock prices increase accordingly.
Surprisingly, this is not the case.
This section provides academic evidence that value stocks grow their earnings faster than glamor stocks.
In 1987, Werner De Bondt and Richard Thaler published a fascinating paper in the Journal of Finance titled ‘Further Evidence on Investor Overreaction and Stock Market Seasonality’.
There were many interesting findings in this paper, but one of the most surprising is that value stocks tend to grow their earnings-per-share faster than glamor stocks.
More specifically, the authors ran six replications dated at 1969, 1971, 1973, 1975, 1977, and 1979. During these replications, the authors identified the stocks in the highest quintile based on the price-to-book value (the glamor decile) as well as the stocks in the lowest quintile based on price-to-book value (the value decile).
The authors then adjusted the sample companies’ earnings-per-share, indexing them at 100 in the year under study.
This research shows that while glamor stocks had stronger historical earnings growth, value stocks actually had superior future earnings growth.
This evidence is shown in the table below (in the row with the circled headings).

Source: Further Evidence on Investor Overreaction and Stock Market Seasonality
Graphically, Bondt & Thaler’s research can be seen as follows:

Source: Further Evidence on Investor Overreaction and Stock Market Seasonality
Before the hypothetical portfolio’s construction, glamor stocks (the most overvalued stock market quintile) had been growing earnings quickly while value stocks (the most undervalued quintile) had seen earnings decrease.
This is unsurprising. In fact, this is the reason why one group is overvalued and the other is undervalued. Investors were willing to pay up for the expectation of strong future earnings growth.
What is surprising is that value stocks had higher earnings – on average – four years after the portfolio’s construction.
What causes this surprising fundamental trend?
Sectors with strong earnings growth (the glamor quintile) had very attractive economics, which invited competition and reduced future earnings growth. Conversely, the historical underperformance of value stocks led many companies to leave these industries, reducing competition and generating stronger future earnings growth.
This research shows that value stocks can deliver investment returns through more than just valuation changes.
It also shows that value stocks can make great investments based on their fundamental business growth, and that value investing does not necessarily need to be cigar butt investing (picking up a failing, undervalued business for one last profitable puff of tobacco – valuation expansion).
Value Investing Evidence #4: The Outperformance of ‘Unexcellent’ Companies
In the early 1980s, authors Tom Peters and Robert H. Waterman Jr. published In Search of Excellence: Lessons From America’s Best-Run Companies.
This non-fiction book claimed to identify the quantitative characteristics of high-quality businesses. Unsurprisingly, these characteristics were:
- Strong asset growth
- Strong shareholders’ equity growth
- Expensive valuation multiples (primarily based on the price-to-book ratio)
- High returns on total capital, assets, and equity
The original list of excellent businesses identified in In Search of Excellence can be seen below.

Source: In Search of Excellence: The Investor’s Viewpoint
This list definitely contains high-quality businesses, including many Dividend Aristocrats and Dividend Kings – Procter & Gamble (PG), Johnson & Johnson(JNJ), 3M (then called Minnesota Mining & Manufacturing) (MMM), McDonald’s (MCD), and Wal-Mart (WMT).
Naturally, authors that claim to know the secret sauce of high-quality businesses are going to face some backlash from the rest of the markets.
Indeed, it was not long before Peters & Waterman had their first published counterargument.
In 1987, Michelle Clayman published In Search of Excellence: The Investor’s Viewpoint, a peer-reviewed research article where she investigated the merits of investing in excellent companies.
One of her key findings was that excellent companies do not tend to remain excellent indefinitely. In fact, during the time period that she investigated (1976-1985), the very characteristics that made an excellent company excellent deteriorated over time.
This data can be seen below.

Source: In Search of Excellence: The Investor’s Viewpoint
Another component of Clayman’s research was an investigation into the performance of ‘unexcellent’ companies – those with characteristics opposite to the excellent businesses outlined in Peters & Waterman’s book.
Clayman’s original ‘unexcellent’ businesses can be seen in the following table.

Source: In Search of Excellence: The Investor’s Viewpoint
Surprisingly, there are a few corporations on this list that (arguably) have very high-quality businesses. Sherwin-Williams (SHW) is perhaps the most notable example. This shows that over time, businesses have the potential to dramatically improve their operations.
The truly interesting observation from Clayman’s research was the outperformance of unexcellent companies. In her sample period (the early-to-mid 1980s), the unexcellent companies dramatically outperformed the excellent companies.

Source: In Search of Excellence: The Investor’s Viewpoint
More specifically, unexcellent companies delivered monthly alpha (or outperformance) of 1.0% (or 12.6% annually) over the S&P 500, compared to 0.16% (or 1.9% annually) for excellent companies.
And, the unexcellent companies generated these excess returns without creating additional risk (as measured by volatility). Compared to the excellent companies, the unexcellent companies had essentially the same beta (1.18 compared to 1.17) and standard deviation (17.7% versus 18.0%).
Clayman posited that the outperformance of unexcellent companies was primarily driven by their low price-to-book ratios (which were selected on the basis of being opposite to the valuations of excellent companies).
Clayman’s research was not done. This would not be a complete summary without mentioning Clayman’s later research.
In 1994, Clayman published an additional paper called Excellence Revisitedwhere she performed additional market research that compared the performance of excellent and unexcellent businesses.
This time, she used a different time period (1988-1992). And, unexcellent companies actually lagged the excellent companies by .1% (although both groups of companies delivered excellent returns of ~13% per year over 5 years).
Details about the financial characteristics and annualized performance of the two groups of stocks in Clayman’s later research can be seen below.

Source: Excellence Revisited
Clayman’s research suggests that ‘unexcellent’ companies may outperform excellent companies, although her findings were slightly inconclusive.
With that said, the author was very convinced that when the unexcellent companies did outperform, it was primarily due to their lower valuations as measured by the price-to-book ratio.
Value Investing Evidence #5: The Outperformance of NCAV Stocks
Value investing aims to identify stocks trading at less than their intrinsic value.
We can take this one step further – instead of investing in companies trading at less than their intrinsic value, we can invest in companies trading at less than their liquidation values, which is the amount of money that would be distributed to shareholders if the business were to be wound up and all the assets sold.
So how do we determine the liquidation value of a publicly-traded business?
Determining liquidation values is a difficult and imprecise science. Generally speaking, liquidation value is approximated by calculating net current asset value (NCAV), a strategy popularized by value investing pioneer Benjamin Graham.
Strategies for calculating NCAV vary. Investors take balance sheet items and discount them at different rates based on the difficulty or time required to exchange these balance sheet items for cash.
Other factors may also increase discount rates – for instance, a grocer’s merchandise inventory will be discounted because some of the inventory has the potential to spoil in storage.
Benjamin Graham’s book Security Analysis provides great detail on computing the NCAV of publicly-traded stocks, particularly in Chapter 34 –Significance Of The Current-Asset Value. Here is a table from my copy of Graham’s book showing recommended discount rates for various balance sheet items:
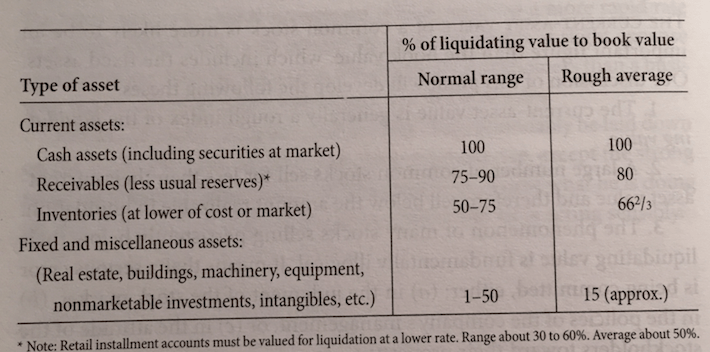
Source: Security Analysis, Chapter 34 – Significance Of The Current-Asset Value
Clearly, there is much variability in the calculation of net current asset value.
What does not vary is the outperformance of stocks trading below their NCAV – called ‘NCAV stocks’ or ‘net-nets’.
In Tobias Carlisle’s book Deep Value, he studied the performance of NCAV stocks between 1983 and 2008 and found that they outperformed by the market indices by about 22% per year.
Carlisle also noted that net-net stocks tend to behave differently than the general stock market on an individual level.
More specifically, an individual net-net stock is far more likely to go to zero than a random security picked out of the global universe of stocks. About 6% of net-net stocks go to zero, compared to roughly 2.5% for the broader stock market.
Intuitively, this means that the net-nets that do not go bankrupt have to deliver fantastic performance to compensate for those that go to zero. That is indeed the case.
In fact, stratifying the net-net stock universe by characteristics reveals some interesting performance traits. The best-performing net-net stocks are those that 1. do not pay dividends and 2. are not profitable (i.e. they are operating at a loss at the time of purchase).
This is completely counterintuitive. Common sense would suggest that you should invest in profitable, dividend-paying stocks.
Carlisle’s research suggests that applying this strategy to net-net stocks would actually lead you to underperform (on average).
Tobias Carlisle is not the only investor who has found that NCAV stocks outperform the market.
In similar research, GMO Capital Strategist James Montier studied the performance of NCAV stocks between 1985 and 2007 and found that they outperformed the market indices by 17% per year.
NCAV stocks are the ‘best of the best’ in terms of value investing. However, they are very difficult to find and often exist only among small cap businesses. This helps to catalyze market inefficacies and generate such phenomenal returns for NCAV value investors.
Final Thoughts
This article provided 5 pieces of evidence to support value investing – the strategy of purchasing stocks at discounts to their intrinsic value.
What does the data suggest?
Value investing works.
And, it works for reasons other than the obvious (low valuations). Value stocks surprisingly have delivered stronger earnings growth than glamor stocks, and there is an abundance of evidence to show that value stocks outperform glamor stocks.
The reason why we are able to confidently recommend our quantitative ranking system – The 8 Rules of Dividend Investing – is because of the robust evidence to support the success of this strategy.
This article only scrapes the surface. There is an incredible amount of other evidence to support value investing, which we encourage you to read if you have any questions or doubts about this investment strategy.
Disclosure: Sure Dividend is published as an information service. It includes opinions as to buying, selling and holding various stocks and other securities.
However, the publishers of Sure ...
more

