
Above The 40 – Here We Go Again – Stock Market Trips Over Trade War Talk
AT40 = 48.7% of stocks are trading above their respective 40-day moving averages (DMAs)
AT200 = 51.9% of stocks are trading above their respective 200DMAs
VIX = 16.4
Short-term Trading Call: bullish
Commentary
It’s like deja vu again. The smoke just barely cleared from defusing Trump’s tripwire over trade wars, and now the market is wrestling with rumors that President Trump is considering tariffs on $60B in Chinese exports to the U.S. The headlines helped disturb a strong start to the trading day (I suppose Trump’s abrupt firing of Secretary of State Rex Tilerson added more negative weight to the day as well). The day ended for tech with bearish engulfing patterns eerily reminiscent of the topping pattern that preceded the last test of support at 50-day moving averages (DMAs). The Nasdaq and the PowerShares QQQ ETF (QQQ) tumbled 1.0% and 1.4% respectively.
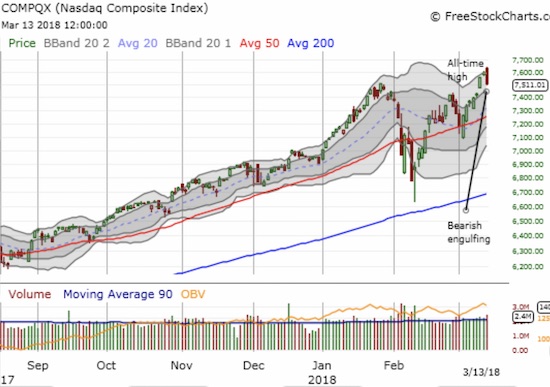
The Nasdaq fell from an all-time high with a 1.0% loss and a toppy bearish engulfing pattern. The close lined up exactly with the former all-time high and represents a reversal of the recent breakout.
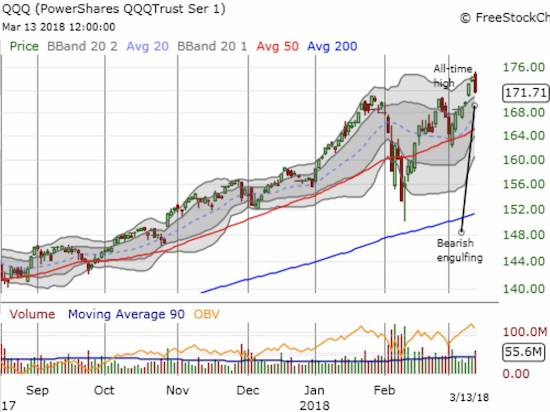
The PowerShares QQQ ETF (QQQ) lost 1.4%. Like the Nasdaq, QQQ printed a toppy bearish engulfing pattern and nearly reversed the recent breakout.
While the threat with tech stocks is a false breakout, the iShares Russell 2000 ETF (IWM) printed a bearish engulfing right at a test of all-time highs. Now IWM looks like a double-top.
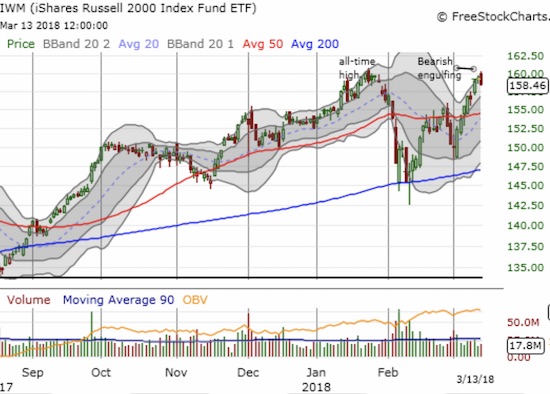
The iShares Russell 2000 ETF (IWM) printed a double-top with a bearish engulfing pullback.
The S&P 500 (SPY) avoided the ominous bearish engulfing pattern. Still, its 0.6% loss brought momentum from last Friday’s breakout to a screeching halt. Suddenly, another test of 50DMA looks more likely to happen before a new all-time. I thought and hoped that tech’s new all-time highs blazed a path higher for the S&P 500.
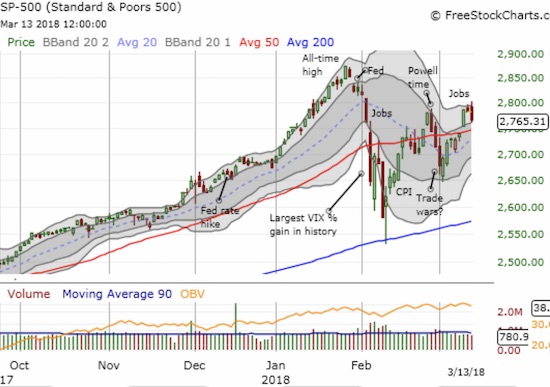
The S&P 500 (SPY) lost 0.6% but stayed within its upper-Bollinger Band (BB) channel.
The volatility index, the VIX, delivered good news under the circumstances. The fear gauge “only” increased 3.6% and remained within the “gravitational pull” of the 15.35 pivot line.
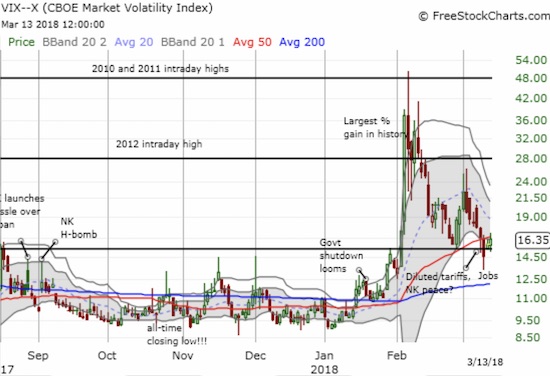
So far the volatility index, the VIX, is sticking close to its 15.35 pivot.
Finally, AT40 (T2108), the percentage of stocks trading above their respective 40DMAs, dropped a mere 2 points to 48.7%. My favorite technical indicator tells me that the selling in the market was not broadly and deeply based. In other words, the prospects are still high for an immediate bounce-back. So while I brace for yet more churn in the short-term trading call, I am sticking with the bullish bias. A 50DMA breakdown could of course change things all over again.
CHART REVIEWS
Dick’s Sporting Goods (DKS)
DKS had a wild day post-earnings. In the pre-market, DKS was apparently down as much as 7%. The stock gapped down below its 50 and 200DMAs and lost as much as 9.3%. So the subsequent rebound to close UP 1.0% is very impressive and likely bullish. Given I harbor lingering hopes for the retail trade in 2018, DKS has my attention. Going into earnings, I held shares and a covered call with a $32 strike to take advantage of the pre-earnings premium. If the shares get called away, I will be looking for a new entry point. DKS is in the beaten down sporting goods sector so its valuation is very cheap: 12.1 trailing P/E, 10.9 forward P/E, 0.4 price/sales, and 1.8 price/book. Bears are weighing on the stock to the tune of 17.1% of the float sold short.
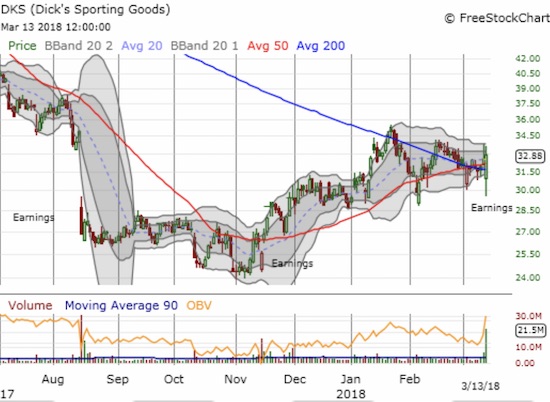
Dick’s Sportings Good (DKS) has trended upward from a November major low that was confirmed with a post-earnings rebound. With 50 and 200DMAs converged, the stock sits at a critical juncture.
Qualcomm (QCOM)
President Trump blocked Broadcom’s (BRCM) bid to buy QCOM for $82/share ostensibly for national security concerns. I read and hear some blame these headlines for the outsized weakness in tech. QCOM gapped down for a 5.0% loss and stopped just short of its 200DMA support at the low of the day (can’t make this stuff up!). This drama is complicated (including QCOM’s bid for NXP Semiconductors (NXPI)), but what I see is a market valuing a company for much less than a major company’s willingness to pay. Moreover, analysts were falling over each other in the past few months to hike price targets accordingly. So, if the 200DMA survives this test, I will likely start accumulating shares (and/or call options).
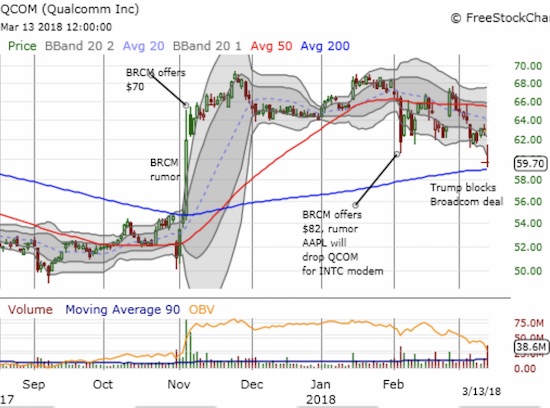
Qualcomm (QCOM) gapped down to a test of its 200DMA support.
— – —
“Above the 40” uses the percentage of stocks trading above their respective 40-day moving averages (DMAs) to assess the technical health of the stock market and to identify extremes in market sentiment that are likely to reverse. Abbreviated as AT40, Above the 40 is an alternative label for “T2108” which was created by Worden. Learn more about T2108 on my T2108 Resource Page. AT200, or T2107, measures the percentage of stocks trading above their respective 200DMAs.
Active AT40 (T2108) periods: Day #18 over 20%, Day #7 over 30%, Day #3 over 40% (overperiod), Day #25 under 50%, Day #26 under 60%, Day #32 under 70%
Daily AT40 (T2108)

Black line: AT40 (T2108) (% measured on the right)
Red line: Overbought threshold (70%); Blue line: Oversold threshold (20%)
Weekly AT40 (T2108)

*All charts created using freestockcharts.com unless otherwise stated
Be careful out there!
*Charting notes: FreeStockCharts.com uses midnight U.S. Eastern time as the close for currencies. Stock prices are not adjusted for dividends.
Full disclosure: long SPY calendar call spread, long SPY shares and calls, long QQQ call spread, long QQQ calls, long DKS and short covered call, short VXX
Follow Dr. Duru’s commentary on ...
more

