
Above The 40 – A Deepening Bearish Divergence For The S&P 500 Tarnishes Apple’s Moment
(“Above the 40” uses the percentage of stocks trading above their respective 40-day moving averages [DMAs] to assess the technical health of the stock market and to identify extremes in market sentiment that are likely to reverse. Abbreviated as AT40, Above the 40 is an alternative label for “T2108” which was created by Worden. Learn more about T2108 on my T2108 Resource Page. AT200, or T2107, measures the percentage of stocks trading above their respective 200DMAs.)
AT40 (T2108) Status: 52.3%
AT200 (T2107) Status: 65.6%
VIX Status: 11.8
Short-term Trading Call: neutral
Commentary
The S&P 500 (SPY) can thank its ability to stay out of negative territory to earnings from Apple (AAPL).
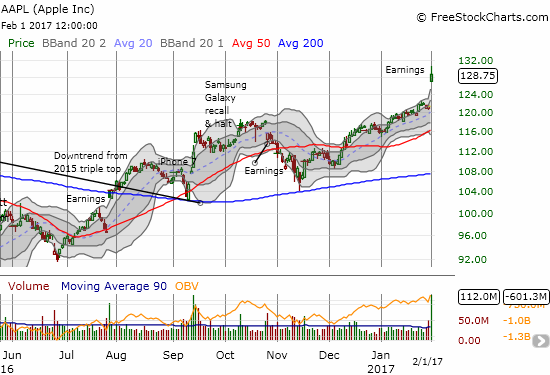
Apple gapped up to a 6.1% post-earnings gain and a new 18-month high.
This impressive 6.1% gain was just enough to help squeeze the S&P 500 into a close flat with the previous day’s close. The flat close also means the index still sits right on my line in the sand between a bearish (below) and a neutral (above) trading call.
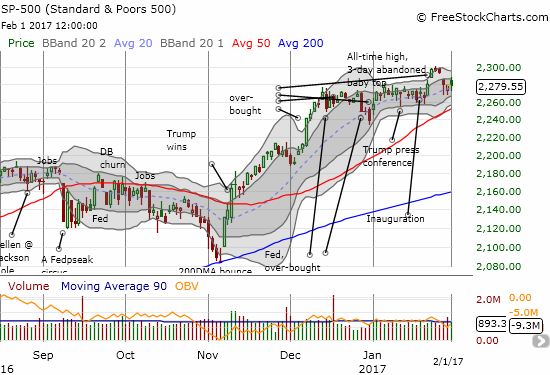
The S&P 500 finished flat on the day after briefly challenging last week’s bearish abandoned baby top pattern.
We know that AAPL was the main savior of the S&P 500 because AT40, the percentage of stocks trading above their respective 40DMAs, tumbled significantly on the day. AT40 hit a new 2 1/2 month low and looks ready to reverse all of its post-election gain. For the past 3 days, AT40 has returned to a downtrend that refreshed the warning sign of a bearish divergence with the S&P 500. The S&P 500 sits comfortably within the confines of its earlier trading range while stocks in general are slowly but surely declining (dropping below their 40DMAs).
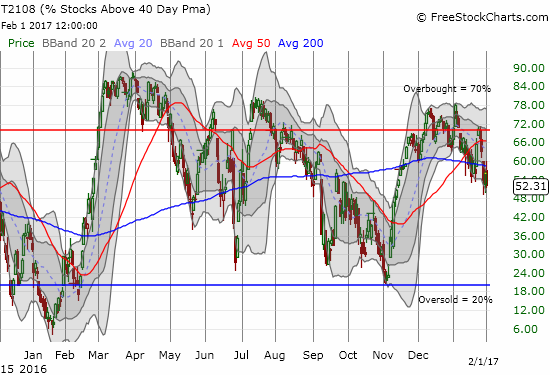
AT40 (T2108) closed at a 2 1/2 month low as a bearish divergence with the S&P 500 picks up steam again.
The month of February started with another pronouncement on monetary policy from the U.S. Federal Reserve. The statement contained nothing new, and it looked like a copy and paste from so many similar past statements. No surprise then that the net market reaction was very muted. The market next looks forward to the U.S. employment report on Friday.
While the S&P 500 ended the day flat, some important individual stocks made important moves. I noted three meaningful tests of 50DMA support: Goldman Sachs (GS), Caterpillar (CAT), and Intel (INTC).
GS failed the test on Tuesday as it broke down on high trading volume. This kind of break would normally immediately motivate me to short GS. Yet, given its high status as a core part of the Trumpflation rally, I am waiting to see whether sellers actually generate follow-through. Today, GS managed to gap up a little bit, rally toward 50DMA resistance, and then close near where it opened.
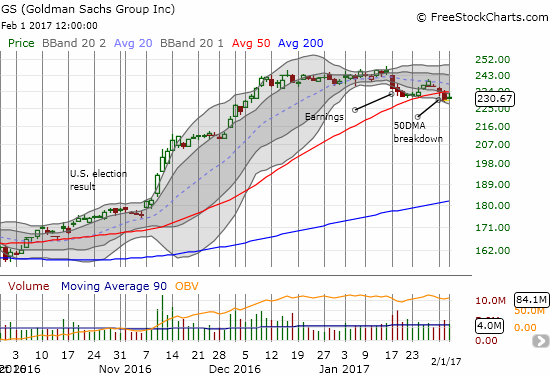
Goldman Sachs may hold a key to the market’s next move as it deals with an important breakdown below 50DMA support and post-earnings follow-through selling.
Caterpillar bounced off its 50DMA support for the second day in a row. Unlike GS, I would short CAT as soon as it closed below support; granted, I imagine short-term downside may be limited to the bottom of the previous trading range.
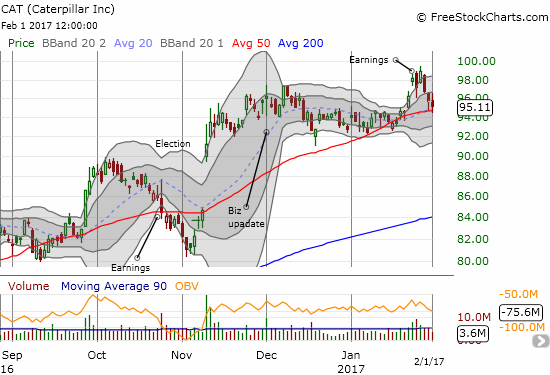
Caterpillar has invalidated what was a very bullish gap up and breakout ahead of earnings. Can it pass the current 50DMA test?
Intel has already returned to the lower part of its previous trading range. The stock briefly cracked 50DMA support before bouncing back. Hearkening to my earlier strategy of buying INTC in between earnings, I decided to BUY some March call options on the 50DMA test. If support ultimately fails, my next buy point would be a retest of 200DMA support. Hopefully on such a scenario AT40 would be flashing oversold (below 20%).
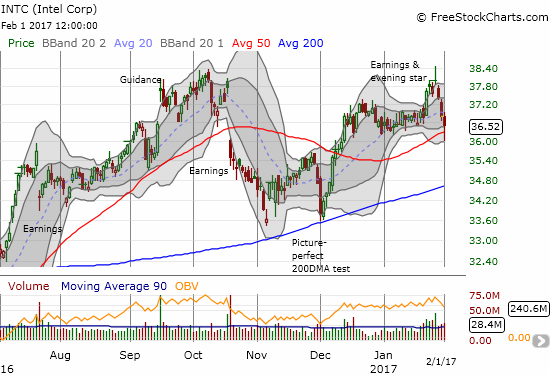
Intel finally found some post-earnings support around its 50DMA. Failure here immediately puts 200DMA support into play.
All three of these stocks are immediate reminders that all is not well under the covers of the major indices. Yet, I must keep the short-term trading call at neutral because the bears and sellers are still failing to punch in convincing confirmation of the bearish tidings from the near month-long bearish divergence.
Finally, in the land of foreign exchange the U.S. dollar (DXY0) remains in focus after a horrible performance in January. The U.S. dollar index lost about 2.5% during a time in which U.S. President Donald Trump and members of his team took various opportunities to talk down the U.S. dollar and talk up the currencies of trade partners (competitors?). The dressdown made for the dollar’s worst January in 30 years. Like may forex traders, a large loss in the U.S. dollar to start 2017 was nowhere close to my radar. This surprise likely flags the start of what promises to be a year full of (complete) surprises in financial markets.
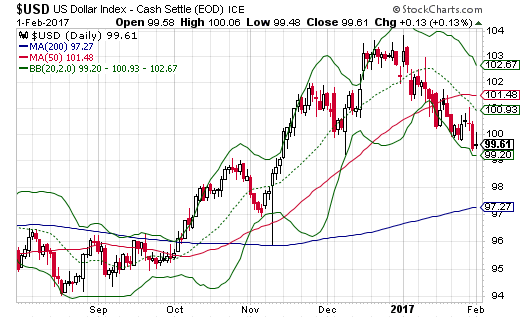
The U.S. dollar index (DXY0) hangs precariously at the bottom of a downward trending channel…
Source: StockCharts.com
Active AT40 (T2108) periods: Day #239 over 20%, Day #59 over 30%, Day #58 over 40%, Day #56 over 50% (overperiod), Day #3 under 60% (underperiod), Day #5 under 70%
Daily AT40 (T2108) vs the S&P 500

Black line: AT40 (T2108) (measured on the right); Green line: S&P 500 (for comparative purposes)
Red line: AT40 (T2108) Overbought (70%); Blue line: AT40 (T2108) Oversold (20%)
Weekly AT40 (T2108)

*
All charts created using freestockcharts.com unless otherwise stated
The charts above are my LATEST updates independent of the date of this given AT40 post. For my latest AT40 post click here.
Related links:
The T2108 Resource Page
You can follow real-time T2108 commentary on twitter using the #T2108 or #AT40 hashtags. T2108-related trades and other trades are occasionally posted on twitter using the #120trade hashtag.
Full disclosure: long and short positions versus the U.S. dollar, long INTC call options
Follow Dr. Duru’s commentary on financial markets via more


Thanks for sharing