
A Vision For The European Economic Future
I have seen the future of the European Economy and it is not looking good.
The EU tracks a wide number of European wide economic indicators, everything from consumer credit, to unemployment expectations in the future.
Much of the data is survey based and so it involves an individual opinion on a subject.
It is simply amazing how well much of these indicators work as contrarian indicators! The old saying goes, "when your taxi driver tells you to buy stocks, it is time to sell ".
Lets have a run down through some of these charts to set the scene in Europe.
Consumer confidence rate of change:
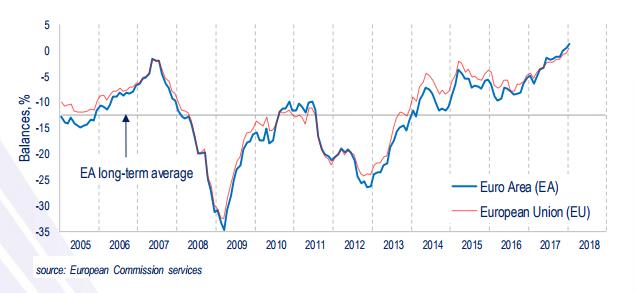
This indicator increased at the highest rate in over 13-yrs in December, accelerating at a faster rate than every year running up to the 2007 high in stocks.
Consumer credit:
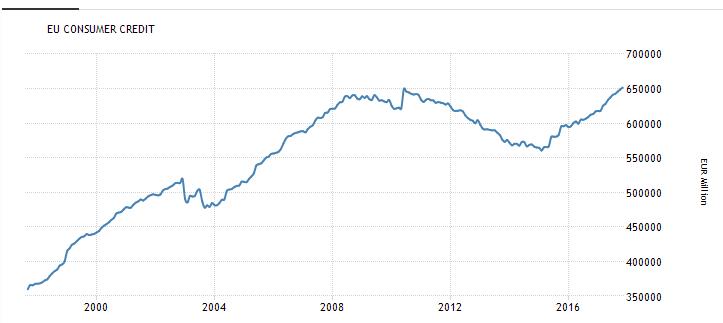
The level of revolving credit to the consumer has now hit its highest level in history! The consumer has maxed out the credit card again.
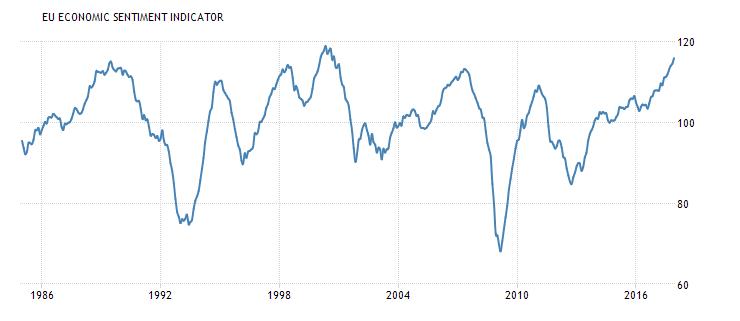
EU economic sentiment indicator: This index has hit a 18-yr high.
Gross household savings rate:

People are so confident, that they have stopped saving! This index is now at the lowest level since they began tracking.
Unemployment expectations:
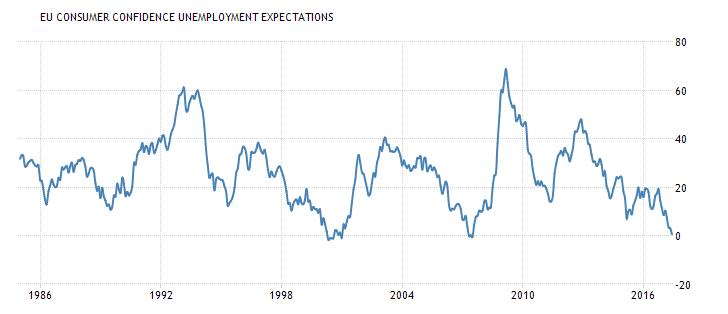
People in Europe do not expect to become unemployed any time soon. This indicator now matches the sentiment at the high in 2000 and in 2007! And what happened following those particular sentiment extremes?
So, according to the man on the street, the general outlook for the European economy is for a bright future with absolutely no upsets whatsoever, everything is just fine in Europe!
And of course the EURUSD is sitting at a three year high, at the end of a very large corrective pattern. What could possibly go wrong?
On that note, lets get into the latest wave patterns in operation in EURUSD.
UPCOMING RISK EVENTS:
USD: Advance GDP q/q, Durable Goods Orders m/m.
EUR: M3 Money Supply y/y,
GBP: Prelim GDP q/q, BOE Gov Carney Speaks.
JPY: BOJ Gov Kuroda Speaks.
EURUSD
30 min
(Click on image to enlarge)

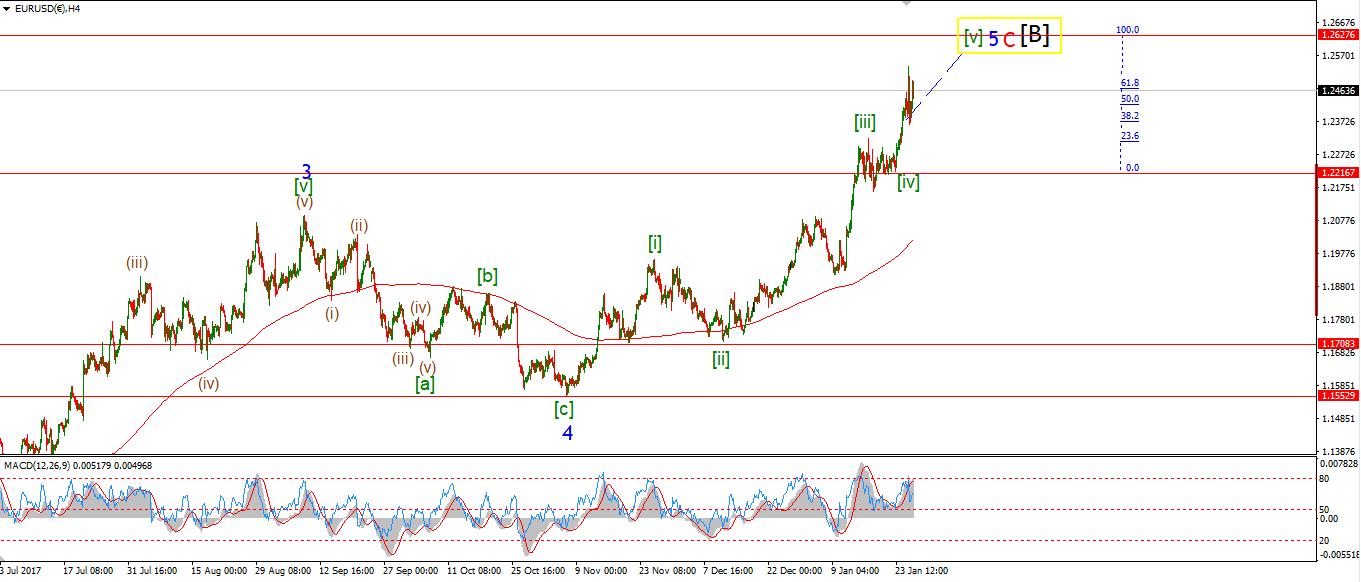
4 Hours
(Click on image to enlarge)
Daily
(Click on image to enlarge)
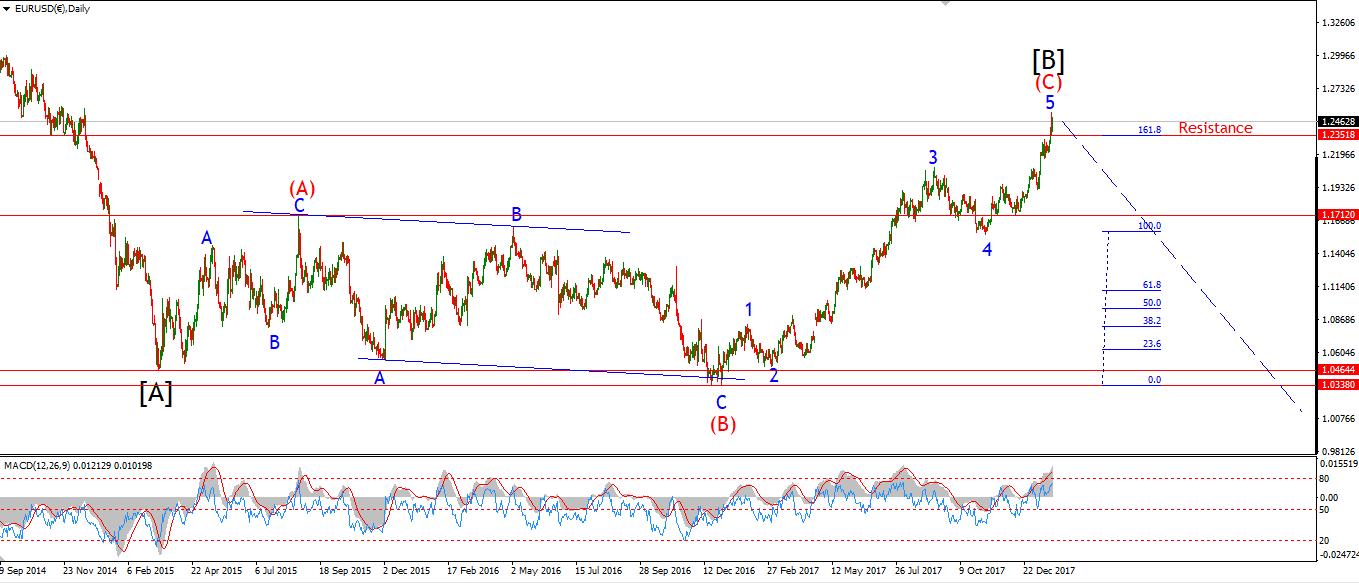
My Bias: long term bearish
Wave Structure: Topping in wave [B] black.
Long term wave count: lower in wave [C] black.
The correction in wave 'iv' pink was short lived today. Wave 'iv' seems to have traced out a running flat correction. And off that low today the market shot higher in wave 'v' pink.
That completes a five wave pattern in wave (iii) brown. Wave (iv) has started this evening with initial support at the previous fourth wave of 1.2385. The price is moving lower as I write, so wave (iv) brown might complete quite quickly also.
For tomorrow watch for a low in wave (iv) brown at nearby levels. Wave (v) brown should then carry the price higher into the target at 1.2600 to complete the larger five wave structure.
Want to know the next big move in the Dollar, GOLD and the DOW?
Check out our membership plan over at ...
more

