
A Popular Tactical Model Goes To 100% Cash. Now What?
The tactical asset allocation model that’s outlined in Meb Faber’s widely read paper–the most downloaded paper on SSRN.com, in fact—went to cash at the end of last month, Bloomberg reported earlier this week. The risk-off move has attracted a fair amount of attention, which isn’t surprising, given the fame and influence of the 2006 paper (and its revisions)– “A Quantitative Approach to Tactical Asset Allocation.”
The model’s highly regarded reputation can be traced to a combination of simplicity and success, at least from the vantage of the paper’s back-tested results, which span four-decades starting in the early 1970s. In many respects, the work is a tour de force and has inspired countless studies that consider (and reconsider) momentum-based strategies for managing risk and otherwise avoiding deep losses a la the 2008 crash. But for all the well-deserved accolades, there’s a caveat that tends to be overlooked: the model’s not flawless.
That’s hardly a radical statement. Indeed, no model is perfect, which is to say that every model is flawed in some way. At its core, there’s much to admire about Faber’s model, if only as a foundation for deeper analysis. There are also plenty of questions in terms of how (or if) to apply the model’s signals in real time. According to one pundit, the prudent thing to do is to water down the all-cash message. “I wouldn’t go 100% anything,” writes Brett Arends at MarketWatch.com.
That’s a prudent bit of advice for an obvious reason: nothing’s guaranteed in money management. If you have 100% confidence in a model’s ability to provide accurate real-time insight for navigating the future, extreme decisions could be rationalized. But ours is a world with more than a trivial amount of uncertainty, a challenge that no amount of backtesting can overcome. Accordingly, no model—even one as influential and acclaimed as Faber’s—should be put on a pedestal.
If you spend enough time backtesting models and deconstructing their rules, you’ll find a common thread: sometimes they work, sometimes they don’t. That’s the one iron law that applies to every investment model that seeks to time markets in some degree or another. Alas, it’s never clear in real time when a model is stumbling–until we have the clear-eyed benefit of hindsight.
That’s old news, of course, or at least it should be. As for the challenge du jour—is the risk-off signal in Faber’s model accurate this time? Or, to put it another way, will the out-of-sample test that’s effectively started help or hinder the reputation of Faber’s impressive backtested results? No one really knows at this point.
That doesn’t mean we should ignore the heightened state of risk that’s arising from Faber’s model these days. In fact, negative-momentum warnings have been bubbling across the spectrum of asset classes lately, as I noted in early August.Unless you’ve been on holiday for the last several months, it’s been clear for some time that a momentum-based view of markets has been increasingly cautious. The main distinction of late—the US stock market is no longer excluded from this ignominious club.
Does that mean that the jig is up for the US bull market in stocks? Probably, or so Faber’s model implies. But there’s no guarantee, which is why there’s a strong case for looking to a range of models for making real-world decisions for real-world portfolios.
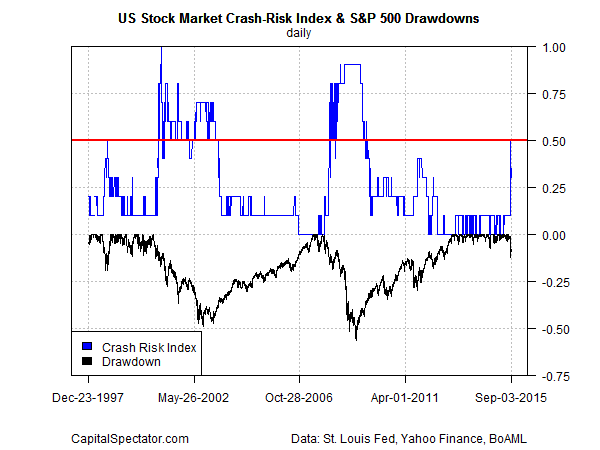
Minds will differ on which models deserve attention (or not). I recently outlined one possibility for a multi-model model for assessing US stock market risk. It’s interesting to note that this take on risk analysis—the Crash Risk Index, as I dubbed it—is telling us that the potential for trouble is higher these days. Higher, but not yet fatal. In recent weeks, five of the 10 components turned bearish, although the threat has receded a bit over the last several days and as of yesterday (Sep. 3) three of ten indicators are flashing red. By contrast, my somewhat subjective view is that only when we’ve moved above 50% is the outlook genuinely dark. By that standard, the current environment still falls short of an all-out sell signal.
The critical factor at this point is the level of business cycle risk for the US. Here too we’ve seen warning signs, but only from a markets-based view of macro so far.The economic data proper, by contrast, continues to look encouraging in terms of supporting forecasts for moderate growth. If that generally upbeat outlook changes for the worse, it’s likely that the Crash Risk Index will turn a deeper shade of red and thereby issue a stronger warning, which in turn will confirm Faber’s all-cash signal.
The key question: is the risk of a US recession on the rise? No, based on the current set of macro reports. That could change, of course. But until it does, the latest round of market turbulence doesn’t look like the start of an extended bear market. The Faber model suggests otherwise, which leads us to the main question: How much faith should you put in one model?
The generic answer: somewhere south of 100%. That still leaves plenty of room for debate about what to do in the current climate. But at least we know what not to do, at least for mere mortals. Going to extremes can look like a sure thing in backtests. In fact, you can count on it since failed backtests rarely see the light of day. That raises the tangled topic of data mining biases, but that’s a subject for another day.
As for best practices for real-world/real-time asset allocation: a degree of nuance is highly recommended. Why? Because tomorrow’s headlines are forever mysterious.
Disclosure: None.


