2018 Year-To-Date Country Stock Market Performance
Below is a look at the 2018 year-to-date performance of various country stock markets around the world. Returns are calculated in local currency, as if you were a domestic investor within each country.
The average year-to-date change of the 75 countries in the table is about as flat as it gets — down just 0.04%. More countries are in the red than in the green, though, with 32 up and 43 down.
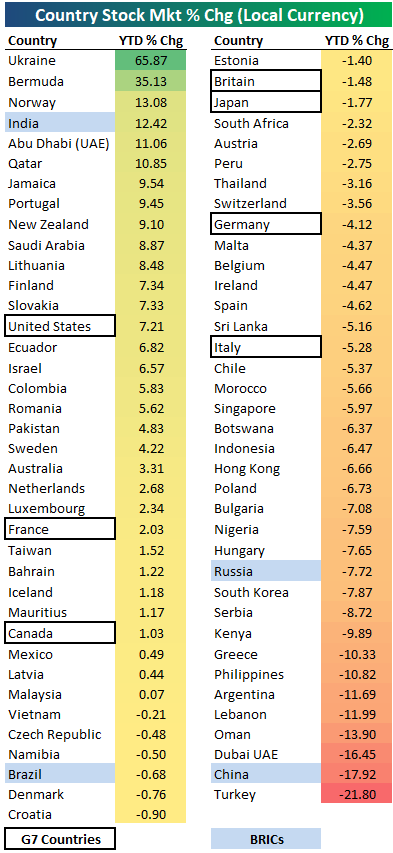
Ukraine ranks at the top of the list with a gain of 65.87%. Bermuda ranks 2nd at +35.13%, while Norway, India, Abu Dhabi, and Qatar round out the top six. These six are also the only countries up double-digit percentages in 2018.
While there are six countries up 10%+ YTD, there are eight that are down 10%+. Turkey is down the most at -21.8%, followed by China at -17.9% and Dubai at -16.45%.
Looking specifically at the G7 countries, the US ranks first with a YTD gain of 7.21%. Along with the US, the only other two G7 countries in the green this year are France and Canada. Italy, Germany, Japan, and Britain are all in the red.
If it weren’t for India’s gain of 12.42%, the BRIC ETF (EEB) would be down a lot more this year. That’s because the other three BRIC countries are all in the red, with China down the most (-17.9%), followed by Russia at -7.7%.