
2018: A Tough Row To Hoe

For most investors, 2018 is turning out to be a tough row to hoe. Suddenly, nobody is talking about global synchronized growth, low inflation, the benefits of tax cuts, and 20% earnings growth. No, all that is now so 2017. Now investors are focused on slowing global growth, rising rates, an overzealous Fed, a global trade war, plunging oil prices, a rising dollar, risk in the corporate credit markets, and de-FAANGing their portfolios.
However, all this negativity is a rather recent development. Recall that until the beginning of October, the 2018 investing game had been pretty simple. Buy U.S. stocks and focus on those popular momentum-oriented names. Easy peasy, right?
But as is often the case, just about the time everybody had figured out the game, everything changed.
So here we are; staring at just 25 trading days left in the year. The bottom line on this fine Monday morning is that most investors are focusing on the negative and fearing the worst. Gone is the hope that ongoing earnings growth will produce strong stock market returns for as far as the eye could see. In its place is the idea of "correcting" prices for the new normal. A "normal" that includes the word "slowing" in front of just about every bullet point in the market narrative.
A Lot Of Red Out There
In looking at the year-to-date returns of the various asset classes through Friday, the appropriate theme song for the year would be, Nowhere to Run. Take a look at the numbers below and you'll see what I mean.

Man, that's a lot of red.
In fact, Ned Davis Research tells us that this could be the first year since 1972 that none of the top eight asset classes (U.S. Large Caps, U.S. Small-caps, International Developed, Emerging Markets, U.S. Treasuries, U.S. Aggregate Bonds, Commodities, and Real Estate) have produced a return of at least 5%. Nowhere to hide, indeed.
Diversification Isn't Helping
This means that diversified portfolios are struggling across the board. For example, the iShares Allocation series, which are ETFs designed to provide a well-diversified portfolio according to varying risk targets, all sport negative returns year-to-date.
- iShares Conservative Allocation Fund (AOK): -2.70%
- iShares Moderate Allocation Fund (AOM): -2.86%
- iShares Growth Allocation Fund (AOR): -3.81%
- iShares Aggressive Allocation Fund (AOA): -4.49%
Allow me to put this situation into perspective. Even in years such as 2008, a year when the U.S. was in a severe recession and a "60/40" portfolio lost -19.8%, there were positive returns to be found in some asset classes (U.S. Treasuries). And then in 1974, there were green numbers to be found in areas such as Commodities.
What's The Answer?
If we are indeed seeing a bear market unfolding here (personally I am still in the "correction" camp at this stage of the game), it is important to recognize that the world is different than it was the last time the bears came to call.
Remember, in 2015-16, investors still had Global QE to count on. In fact, Mario Draghi effectively ended the "mini-bear" when he announced in February 2016 that the ECB was willing to do whatever it took to keep things together (and it didn't hurt that Japan was already on the QE-to-Infinity bandwagon). This was the epitome of what is called the "Fed Put" - where central bankers cuts rates to bail out the markets whenever trouble arises.
However, this time around, there is no QE to save the day (unless things get REALLY ugly, that is). No, we're actually experiencing the opposite as the U.S. Federal Reserve is now thoroughly entrenched in a quantitative tightening phase. Oh, and Jay Powell doesn't seem to be the kind of guy that is likely to bail out the stock market from a 10% pullback.
My point here is that IF (note the use of capital letters) we are entering a full-blown bear market, then we should probably expect to see an old-school type of bear. A market that grinds lower until either the narrative changes or values become appealing. A market environment that takes time to play out.
Next, I'm going to opine that IF the bears are going to stick around for more than a couple of months, then investors are likely to need more than old-school diversification to succeed. In short, a risk-management strategy - a strategy that has been largely out of favor for many years - may help to cushion the blow of a full-on bear.
Game On For The Bears?
Personally, I'm not ready to declare that a bear has begun in the U.S. I see the current action as a corrective phase that can be reversed by either (a) the Fed confirming they won't "overshoot" and will be "data dependent" in 2019, or (b) the declaration of a truce in the trade war with China. I'm of the mind that the market mood would improve dramatically if either of these events were to occur (and especially if both occur).
Finally, I feel strongly that even if the bears do take control of the game for a while, we will NOT see a repeat of 2007-08 (i.e. a decline of more than 50%). No, I favor the "mini-bear" scenario - where a cyclical downturn lasting 6-8 months occurs within an ongoing secular bull move.
In any event, it is important to recognize that the game has changed and that staying flexible is likely the key to success going forward.
Now let's turn to the weekly review of my favorite indicators and market models...
The State of the Big-Picture Market Models
I like to start each week with a review of the state of my favorite big-picture market models, which are designed to help me determine which team is in control of the primary trend.
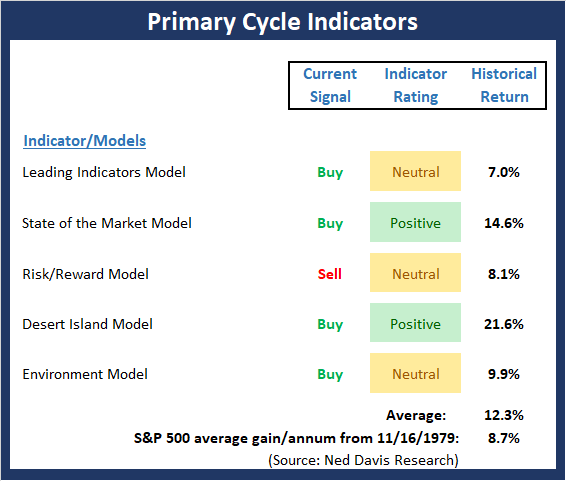
View My Favorite Market Models Online
The Bottom Line:
- As a reminder, the purpose of this indicator board is to determine the "primary" trend of the stock market from a long-term point of view. During times of stress, it is important to keep the big-picture cycle in perspective. The message here continues to be that the secular bull remains intact.
This week's mean percentage score of my 5 favorite models declined to 64.5 (from 71.5%) while the median fell to 65% (from 75%). Finally, while the historical return of the S&P 500 given the current model readings pulled back a bit again this week, the overall reading remains swell above the average.
The State of the Trend
Once I've reviewed the big picture, I then turn to the "state of the trend." These indicators are designed to give us a feel for the overall health of the current short- and intermediate-term trend models.
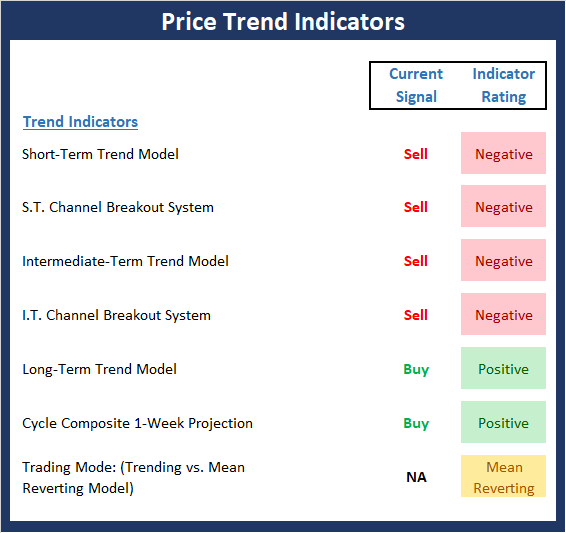
View Trend Indicator Board Online
The Bottom Line:
- The Trend board continues to be weak as the S&P, Dow Industrials, and NASDAQ all closed at new cycle lows on the weekly charts. The good news is the Cycle Composite points higher from now until the end of the year.
The State of Internal Momentum
Next up are the momentum indicators, which are designed to tell us whether there is any "oomph" behind the current trend.
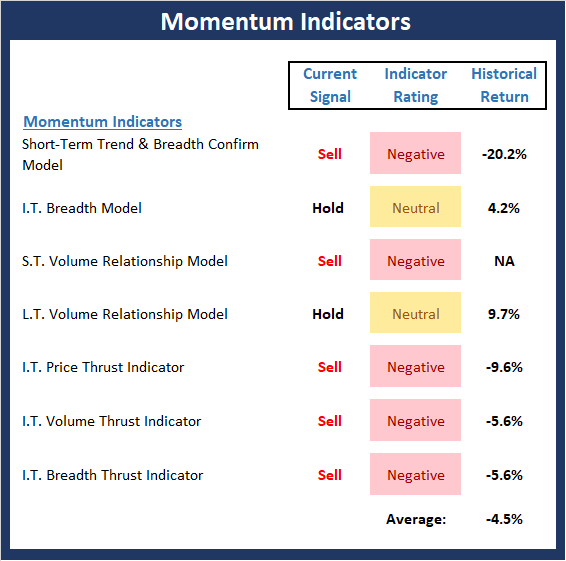
View Momentum Indicator Board Online
The Bottom Line:
- The Momentum board has turned decidedly negative as a key longer-term indicator - the L.T. Volume Relationship Model - flashed a sell signal last week. The only potentially positive takeaway is that momentum may soon enter the "so bad that it's good" zone.
The State of the "Trade"
We also focus each week on the "early warning" board, which is designed to indicate when traders might start to "go the other way" -- for a trade.
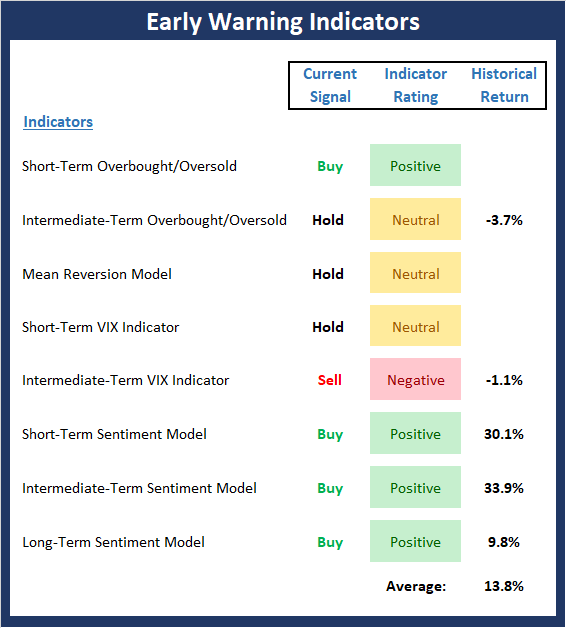
View Early Warning Indicator Board Online
The Bottom Line:
- The "Early Warning" indicators tend to work best when "the stars are aligned," meaning that the various indicators and time-frames are all in the same spot. Unfortunately, this is not the case at the present time. However, the good news is that the indicators are moving in the right direction and could soon become aligned nicely for an end-of-year run.
The State of the Macro Picture
Now let's move on to the market's "environmental factors" - the indicators designed to tell us the state of the big-picture market drivers including monetary conditions, the economy, inflation, and valuations.
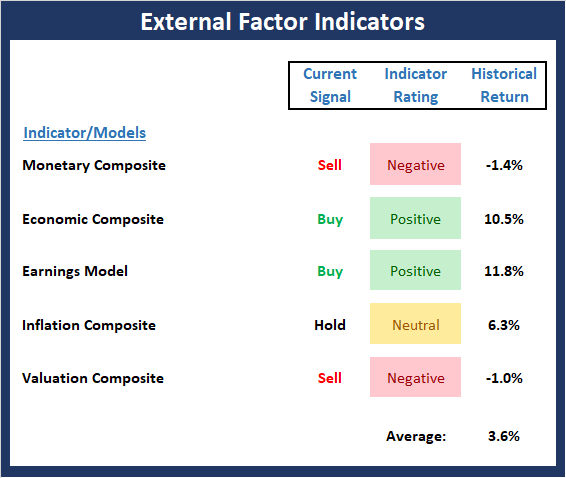
View Environment Indicator Board Online
The Bottom Line:
- The External Factors board continues to provide an excellent assessment of where things stand from a big-picture standpoint. Given the mixed picture here, the takeaway is that risk factors remain elevated and return expectations are subpar.
Disclosure: At the time of publication, Mr. Moenning and/or Sowell Management Services held long positions in the following securities mentioned: none. Note that positions may change at any ...
more

