
Tracking Hedged Portfolio Performance
A few years ago, we developed the hedged portfolio method of investing. The basic idea was to find securities that had high expected returns over the next six months and were also relatively cheap to hedge, and then to buy and hedge a handful of those names every six months.
We backtested the approach a couple of years ago, and wrote it about it on another site at the time. You can also find interactive versions of those backtests on the Portfolio Armor website. Since April though, we've been tracking the performance of portfolios posted in real time. Out of the 6 portfolios created in late April / early May, 5 were beating the market as of Friday's close. Here's a look at the first one.
1st Portfolio
This portfolio was created on April 17th, and was posted here the next day to time-stamp it (there's a day lag with these posts due to editorial review).
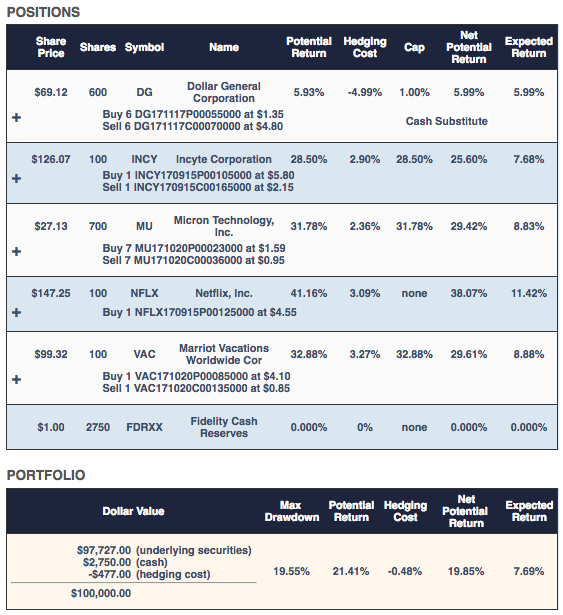
On the Portfolio Armor website, each of the "+" signs in the image above are clickable, and clicking one of them expands the hedge to show you expiration dates, strike prices, etc. more clearly (though you can deduce all that from the option symbology shown above).
To be conservative, for all of these portfolios, we assume you bought the puts at the ask and sold the calls at the bid. The performance tracker takes that into account, and also deducts trading costs on the way in and the way out.
Each position is held for 6 months, or until just before its hedge expires. Since the hedges for NFLX and INCY expired in mid-September, they've already been exited. The table below this chart shows their final values.
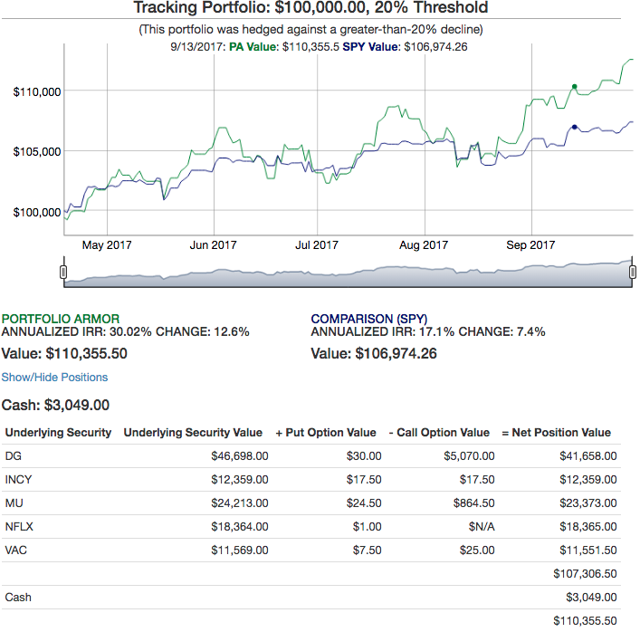
The options are valued every trading day at their intrinsic value, or the midpoint of their bid-ask spread, whichever is higher. You can see that there's not much difference between the two for out of the market options near expiration by looking at the put option value for NFLX there of $1.
Here's an updated version of the image above, as of Friday's close:
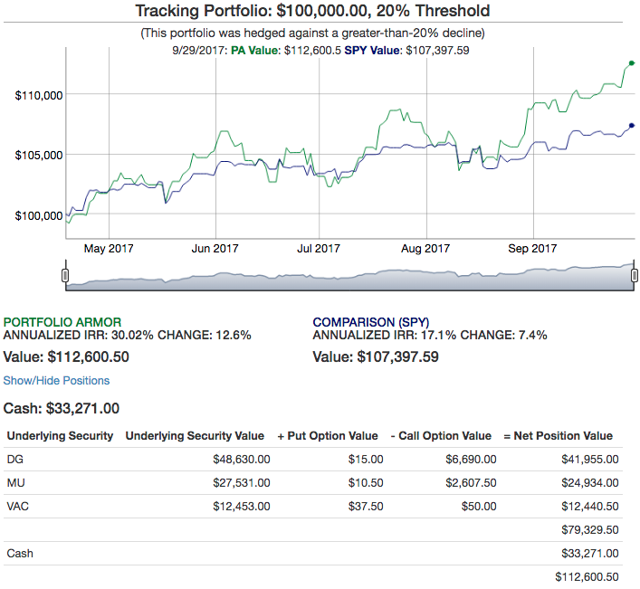
As you can see above, NFLX and INCY no longer appear in the table, and the cash position is larger, as it includes the proceeds from closing out those positions.
Competitive Returns With Less Risk
These portfolios aren't always going to beat the market, obviously, but our tests -- both the backtests as well as these portfolios tracked in real time -- suggest you can generate competitive returns with this method, and do so with less risk than investing unhedged. The portfolio above, for example, is up 12.6% so far, net of hedging and trading costs, versus 7.4% for SPY. And this hedged portfolio would be down no more than 20%, even if every underlying security in it went to zero before its hedges expired.


Good read, thank you.