
The Non-Cyclical Cycle Repeats
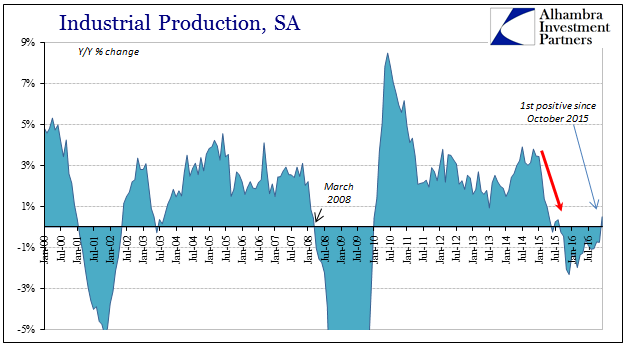
Industrial production rose year-over-year in December 2016, the first plus sign in more than a year. For the month, IP was up 0.5% from the same month in 2015, following declines of 0.7% in each of the prior two months. In seasonally-adjusted, month-over-month terms, IP increased by 0.8% in December after being essentially flat for four months before.
Under normal circumstances that would be cause for celebration, because in a cyclical paradigm when the whole economy or even part of it stops contracting it returns to growth. Though that still remains the widespread, mainstream expectation, it hasn’t been the case at all during the Great “Recession’s” aftermath. What we almost always find instead is contraction followed by slightly positive numbers, or, as has so far been the case in several economic accounts in late 2016, sideways.
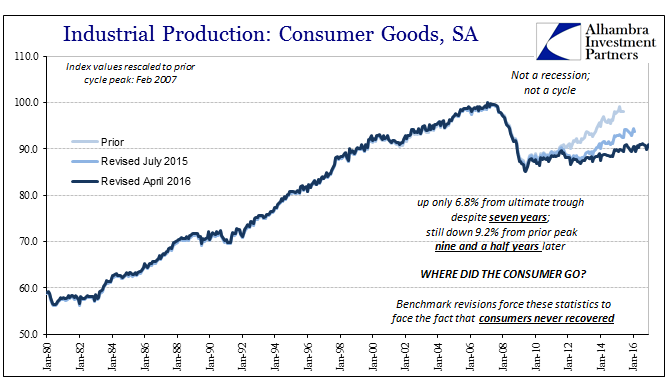
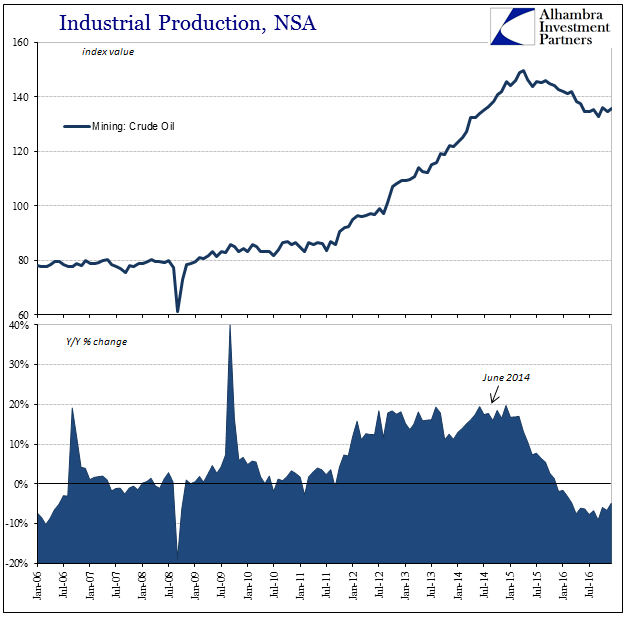
It is the damnedest thing to see of economic considerations, as it really doesn’t make much sense unless you step outside normal parameters. Industrial production displays these odd tendencies more than perhaps other statistics, whether that relates to just the contraction of the “rising dollar” 2014-15, or, as in IP of consumer goods, 2009 forward as a whole.
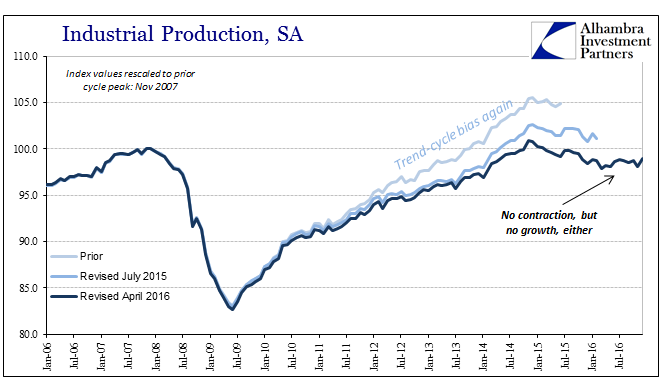
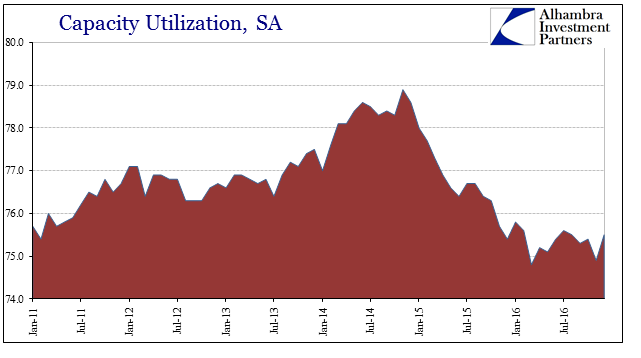
This lack of recovery after these variable declines is essentially the economy, or the related parts represented by whatever account, shrinking and remaining shrunk. That just isn’t supposed to happen, yet here it is in vibrant detail. From capacity utilization to motor vehicle assemblies, even crude oil production, there is a decline followed by sideways nearly every time.
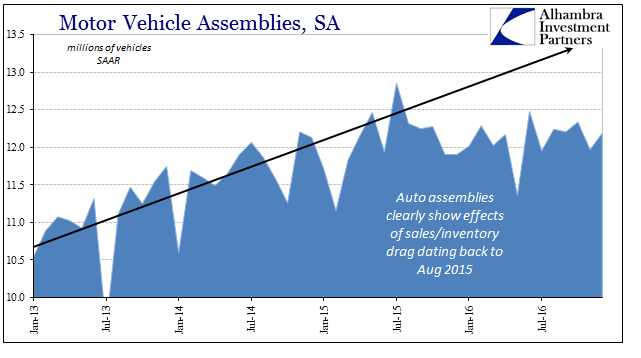
It is the motor vehicle segment that is most important out of the rest of the IP components, as it was automobile and truck manufacturing that supported what little growth was attained during the almost decade of aftermath. As far as motor vehicle assemblies, the estimate for December is 12.18 million (SAAR), which forms the most recent end of what is, again, a disconcertingly almost straight line. MV assemblies first reached 12.1 million as far back as, unsurprisingly, mid-2014, and peaked at just less than 13 million in July 2015 as all the “global turmoil” was about to be unleashed. Since that point, domestic production of autos has been stuck right around 12.1 million, the average over the last 17 months almost exactly that number.

That’s what makes the repeated appearance of sideways or even positive numbers so misleading. Recovery isn’t just growth, it is the attainment of prior levels of growth. As happened in the direct aftermath of the slowdown in 2012, there was no mainstream account for that slowdown even though it remained in effect month after month throughout 2013 and right into 2014. There is simply no way to reconcile that durable change in trend with cyclical expectations and the analytical framework that is derived from them.
That it seems to be happening all over again is no accident, a repeating cycle in a period that is actually overall not cyclical (at least in the accepted, mainstream sense). This would suggest the worst case, where the US economy, and by extension the global economy as a whole, remains stuck as shrunk for yet another internal depression cycle. It is also counterproductive because by and large without minus signs the level of urgency recedes (compare the attitude of FOMC officials, for example, in December 2016 versus December 2015 even though they “raised rates” in both of those months; Janet Yellen’s deer-in-headlights demeanor was obvious in 2015, but far less so a year later even though by and large the economy didn’t change during that year, only her orthodox perception of downside risks did). We end up wasting even more time that we can’t really afford because no longer contracting is, again, given an interpretation that doesn’t apply (restored growth).
The underlying economy has simply progressed far enough from the last direct monetary disruption to have stopped its immediate reduction. There aren’t any good analogies that might better illustrate the process and the results, just as there isn’t historical precedence for this condition. Each time the “dollar” strikes, the economy absorbs the blow and never recovers from it; the larger the blow, the more the shrinking. The panic was obviously the most and most condensed, so it stands to reason that it would leave the largest negative to trend (and actually to the trend). That would suggest that the “rising dollar” may have been (though I would caution that it may not yet be finished, whether or not if and when it strikes again it would be a separate “cycle” or part of the same that began in 2013 and broke out in 2014) worse than the 2011 crisis for the economy (it surely was in global terms, including EM’s this time).
Given the monetary attachments to the point of fixation, for lack of a better term, this won’t end until truly stable monetary conditions are finally re-imposed. It will just keep repeating on and on until the system breaks or it is fixed. The latter is reflation and recovery, the former “reflation” and very familiar to what has already transpired (twice), even if more so sideways (thus far) and more doing sideways (autos) this time around.
Disclosure:
This material has been distributed fo or informational purposes only. It is the opinion of the author and should not be considered as investment advice or a recommendation ...
more

