
Verizon Falls From Dow Top Spot
We can use our data to track individual stocks, industries, sectors, and indices. For today's bulletin, we present key metrics for the top picks in the Dow Jones Industrials. The companies listed below represent the top stocks within the index. They are presented below according to their one-month forecast gain.
When we look at our Dow top-ten list lately, two things are true; we typically see very little turnover, and Verizon (VZ) is number one. This month we see some slight variation to this rule as Verizon has been dethroned as the top Dow stock by IBM. Since we last presented the top Dow picks on October 13th, we also have two newcomers--Wal-Mart (WMT) and Caterpillar (CAT). Those newcomers replaced Dupont (DFT) and Traveler's Insurance (TRV).
Within the remaining eight unchanged components, Cisco (CSCO), United Health (UNH), and JPMorgan Chase (JPM) climbed up along with IBM. Johnson and Johnson (JNJ), Intel (INTC), and Merck (MRK) declined along with Verizon.
Also, be advised that once again we have no STRONG BUY-rated stocks in the Dow right now. Intel, Merck, and Caterpillar are Not ranked BUY, they are all currently rated as HOLDs by our models. The top-seven other DOW companies are BUY-rated stocks.
|
Ticker |
Company Name |
Market Price |
Valuation |
Last 12-M Retrn |
1-M Forecast Retn |
1-Yr Forecast Retn |
P/E Ratio |
Sector Name |
Sept. 8th, 2016 |
|
INTL BUS MACH |
159.29 |
7.60% |
19.13% |
0.86% |
10.33% |
11.84 |
Computer and Technology |
VZ |
|
|
WMT |
WAL-MART STORES |
71.39 |
9.58% |
23.36% |
0.72% |
8.66% |
15.86 |
Retail-Wholesale |
INTC |
|
CISCO SYSTEMS |
31.57 |
9.03% |
17.84% |
0.65% |
7.76% |
14.68 |
Computer and Technology |
TRV |
|
|
UNH |
UNITEDHEALTH GP |
151.5 |
17.44% |
33.10% |
0.56% |
6.66% |
20.03 |
Medical |
|
|
JPMORGAN CHASE |
77.4 |
26.05% |
16.37% |
0.54% |
6.49% |
13.24 |
Finance |
MRK |
|
|
VZ |
VERIZON COMM |
47.93 |
-6.41% |
6.42% |
0.53% |
6.31% |
12.28 |
Utilities |
JPM |
|
JNJ |
JOHNSON & JOHNS |
116.36 |
0.55% |
14.96% |
0.47% |
5.65% |
17.68 |
Medical |
CSCO |
|
INTC |
INTEL CORP |
34.84 |
3.46% |
8.54% |
0.46% |
5.48% |
13.03 |
Computer and Technology |
UNH |
|
MRK |
MERCK & CO INC |
62.63 |
20.69% |
16.63% |
0.40% |
4.77% |
16.44 |
Medical |
|
|
CAT |
CATERPILLAR INC |
93.35 |
20.55% |
32.62% |
0.31% |
3.75% |
28.09 |
Industrial Products |
IBM |
NOTE: New stocks are in BOLD.
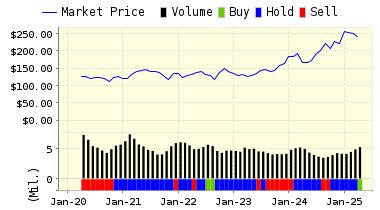
Below is today's data on IBM (IBM):
IBM is an information technology (IT) company. The company operates in five segments: Global Technology Services, Global Business Services, Software, Systems and Technology, and Global Financing. The Global Technology Services segment provides IT infrastructure services and business process services. The Global Business Services segment offers professional services and application management services. The Software segment consists primarily of middleware and operating systems software. The Systems and Technology segment provides computing power and storage solutions; and semiconductor technology products and packaging solutions. The Global Financing segment invests in financing assets, leverages with debt and manages the associated risks. IBM is headquartered in Armonk, New York.
VALUENGINE RECOMMENDATION: ValuEngine continues its BUY recommendation on IBM for 2016-11-16. Based on the information we have gathered and our resulting research, we feel that IBM has the probability to OUTPERFORM average market performance for the next year. The company exhibits ATTRACTIVE Company Size and P/E Ratio.
You can download a free copy of detailed report on IBM from the link below.
|
ValuEngine Forecast |
||
|
Target |
Expected |
|
|---|---|---|
|
1-Month |
160.66 | 0.86% |
|
3-Month |
163.26 | 2.49% |
|
6-Month |
165.62 | 3.97% |
|
1-Year |
175.75 | 10.33% |
|
2-Year |
173.78 | 9.09% |
|
3-Year |
171.76 | 7.83% |
|
Valuation & Rankings |
|||
|
Valuation |
7.60% overvalued |
Valuation Rank |
|
|
1-M Forecast Return |
0.86% |
1-M Forecast Return Rank |
|
|
12-M Return |
19.13% |
Momentum Rank |
|
|
Sharpe Ratio |
-0.21 |
Sharpe Ratio Rank |
|
|
5-Y Avg Annual Return |
-3.67% |
5-Y Avg Annual Rtn Rank |
|
|
Volatility |
17.20% |
Volatility Rank |
|
|
Expected EPS Growth |
3.00% |
EPS Growth Rank |
|
|
Market Cap (billions) |
157.86 |
Size Rank |
|
|
Trailing P/E Ratio |
11.84 |
Trailing P/E Rank |
|
|
Forward P/E Ratio |
11.49 |
Forward P/E Ratio Rank |
|
|
PEG Ratio |
3.95 |
PEG Ratio Rank |
|
|
Price/Sales |
1.97 |
Price/Sales Rank |
|
|
Market/Book |
9.20 |
Market/Book Rank |
|
|
Beta |
0.95 |
Beta Rank |
|
|
Alpha |
0.07 |
Alpha Rank |
|
ValuEngine Market Overview
|
Summary of VE Stock Universe |
|
|
Stocks Undervalued |
40.54% |
|
Stocks Overvalued |
59.46% |
|
Stocks Undervalued by 20% |
17.37% |
|
Stocks Overvalued by 20% |
26.86% |
ValuEngine Sector Overview
|
Sector |
Change |
MTD |
YTD |
Valuation |
Last 12-MReturn |
P/E Ratio |
|
Multi-Sector Conglomerates |
-0.20% |
2.41% |
8.69% |
20.07% overvalued |
3.42% |
19.06 |
|
Industrial Products |
-0.22% |
5.81% |
21.48% |
18.72% overvalued |
14.69% |
23.63 |
|
Aerospace |
-0.24% |
5.50% |
10.05% |
14.31% overvalued |
10.06% |
19.03 |
|
Transportation |
0.36% |
8.57% |
15.84% |
11.70% overvalued |
0.87% |
18.51 |
|
Oils-Energy |
-0.24% |
1.23% |
32.93% |
10.12% overvalued |
0.93% |
26.16 |
|
Construction |
-0.37% |
5.36% |
30.44% |
9.95% overvalued |
14.64% |
20.74 |
|
Computer and Technology |
0.39% |
3.48% |
19.24% |
9.67% overvalued |
8.47% |
29.59 |
|
Finance |
-0.06% |
4.89% |
11.22% |
8.77% overvalued |
6.94% |
16.63 |
|
Basic Materials |
-0.84% |
3.15% |
49.83% |
7.12% overvalued |
58.92% |
27.95 |
|
Business Services |
0.47% |
4.36% |
16.81% |
6.84% overvalued |
-0.49% |
24.20 |
|
Consumer Discretionary |
-0.06% |
3.31% |
8.86% |
5.01% overvalued |
7.64% |
23.68 |
|
Retail-Wholesale |
0.58% |
4.39% |
1.52% |
4.04% overvalued |
5.73% |
22.91 |
|
Utilities |
0.33% |
-0.34% |
10.80% |
3.13% overvalued |
9.69% |
21.28 |
|
Consumer Staples |
0.18% |
-0.50% |
8.96% |
2.14% overvalued |
9.18% |
24.00 |
|
Medical |
-0.76% |
2.98% |
0.24% |
1.09% undervalued |
-9.97% |
26.01 |
|
Auto-Tires-Trucks |
-0.13% |
2.67% |
7.91% |
1.14% undervalued |
13.09% |
14.23 |
Disclaimer: ValuEngine.com is an independent research ...
more


thanks for sharing