
This Dividend Aristocrat Yields 3% And Offers Solid Growth Prospects
TROW has raised its dividend each year for more than 25 consecutive years, qualifying it as one of the 52 dividend aristocrats. The stock has sold off with the market over the last six months, shedding more than 10%. While the stock is sensitive to the market's near-term gyrations, TROW's dividend is extremely safe and appears to offer very strong long-term growth potential. The actively-managed fund industry faces downward fee pressure and increasing competition from lower-cost passively-managed products, but several unique characteristics of TROW's business give us confidence that the company can continue chugging along. Not surprisingly, TROW is one of our favorite dividend stocks.
Business Overview
TROW offers mutual funds and separate accounts that employ a broad range of investment styles, including growth, value, sector-focused, tax-efficient, and quantitative index-oriented approaches. It makes money through investment advisory fees for managing portfolios, which depend on the total value and mix of assets under management.
At the end of 2014, TROW had a record $747 billion of assets under management, with 78% invested in stock and blended asset portfolios and 22% in bond and money market portfolios. By account type, retirement accounts and variable annuity portfolios represented 68% of TROW's assets under management (target-date retirement funds = 20%). Investors domiciled outside the U.S. represented about 6% of TROW's assets.
Business Analysis
Performance and trust drive the asset management business, and TROW has both. TROW has been in business for more than 70 years, demonstrating impressive investment performance over most time periods. For 2014, 74% of the TROW US mutual funds outperformed their comparable Lipper averages on a total return basis for the three-year period ended 12/31/2014, 80% outperformed for the five-year period, 88% outperformed for the 10-year period, and 73% outperformed for the one-year period. Approximately 82% of assets under management in TROW's rated stock, bond, and blended asset funds were given an overall rating of four or five stars from Morningstar at 12/31/2014. Importantly, 100% of TROW's target-date retirement funds (20% of total assets) have outperformed their comparable Lipper averages on a total return basis for the three- and five-year periods ended 12/31/2014. These funds should see strong growth in coming years as more baby boomers near retirement.
With large, risk-averse institutional investors driving more than 80% of industry revenue, investment funds need to have appropriate scale, secure back-end processes, and a long track record of performance success to gain their business. Before making an investment decision, institutional investors undertake an in-depth review of funds, analyzing historical performance, tenure length and quality level of fund managers, the efficiency of back office functions, fund expenses, and the breadth of products offered. Not surprisingly, bigger funds are able to put on a better show and engender more trust throughout the review process.
As one of the 25 largest asset managers in the world, TROW is able to check all of these boxes. Given its brand strength, stable operations, and performance track record, it would likely take years of underperformance or extreme staff turnover before its largest investors decided to take their money elsewhere. While the industry is pretty fragmented, there aren't that many mega asset managers to meet the needs of the largest institutional investors - less than 2% of firms have more than 100 employees, making the biggest firms' relationships with big institutions even stronger (fewer alternative firms to manage their money). TROW's business is especially sticky because of its fee structure, asset mix, and product breadth.
Fees contribute significantly to a fund's overall performance. TROW has been a low cost leader when it comes to fees, significantly helping its overall performance and keeping it further out of the crosshairs of lower-cost passive management. In 2014, TROW's average annual fee was 47.8 basis points, 32% below the average equity mutual fund fee and 16% below the average fixed income mutual fund fee. The company's scale and operational synergies allow it to offer its clients lower costs without hurting its overall profit margins.
While lower fees certainly help performance and client retention (less incentive to switch asset managers as long as performance is "good enough"), TROW's business also benefits from its heavy mix of retirement-related assets, which account for about two-thirds of TROW's assets under management. Retirement-related assets are generally stickier than other types of accounts because these clients are especially looking for a manager offering stability, safety, and trust to ensure their goals are met. In other words, they are less likely to chase performance as wealth preservation is of utmost importance. With more baby boomers nearing retirement by the day, TROW seems well positioned for continued growth and increased business stability.
Finally, TROW has a wide breadth of equity and fixed income mutual fund products and numerous distribution channels. Given the company's high quality reputation and performance figures, it is able to meet most investors' needs if they want to reallocate assets among different funds. Smaller funds do not possess this optionality since their fund options are much more limited. This also helps TROW introduce new products faster to meet different investment trends, such as increasing demand for emerging market funds. The company's reputation and distribution reach allow it to market and scale new products quickly, ensuring the firm stays relevant and continuously increases client retention as trends change.
Taking a quick look at the industry, the total domestic assets of mutual funds is more than $14 trillion today, exceeding their $13 billion peak hit in 2007. Stock funds account for around half of assets, with fixed income products accounting for another 25%. The remainder is split between money market funds and hybrid funds. IBISWorld provides the following data for global portfolio management revenues over the last 15 years. One of the nice aspects of this market is that revenues rise with the market. Sales move higher with little work over longer periods of time, as long as performance doesn't fall out of whack. Since 2002, industry revenue has nearly tripled.
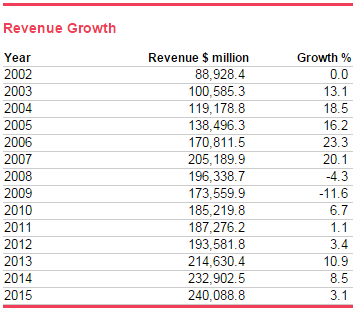
Source: IBISWorld
Market direction influences near-term growth in assets, but there are several other factors that could continue impacting where the industry heads longer-term. Over the last decade, and especially the years following the financial crisis, lower-fee passive investments have taken share from actively-managed funds. This has pressured fees across the industry and resulted in asset outflows for many firms. It is unclear what percentage of the mutual fund market might ultimately be serviced by passive funds, but growth here seems likely to continue. However, on the positive side, aging populations support higher growth in retirement investments (two-thirds of TROW's assets under management), and rising wealth in developing markets should create more opportunities abroad (under 7% of TROW's investors are domiciled outside of the US today).
Key Risks
Coming off six strong years of fixed income and equity market performance, many investors are fearful of a correction. TROW's fee revenue has compounded at a double-digit pace over this time period, providing a healthy lift to earnings. When markets fall, assets under management shrink and many investors fearfully withdraw some of their funds. Lower assets mean less fee revenue, so TROW is sensitive to the market's direction. To highlight this point, consider the stock's performance during the financial crisis. Using our Recession Performance Analyzer tool, we can see that TROW returned -41% in 2008 but rocketed back with the market in 2009, returning 54%.
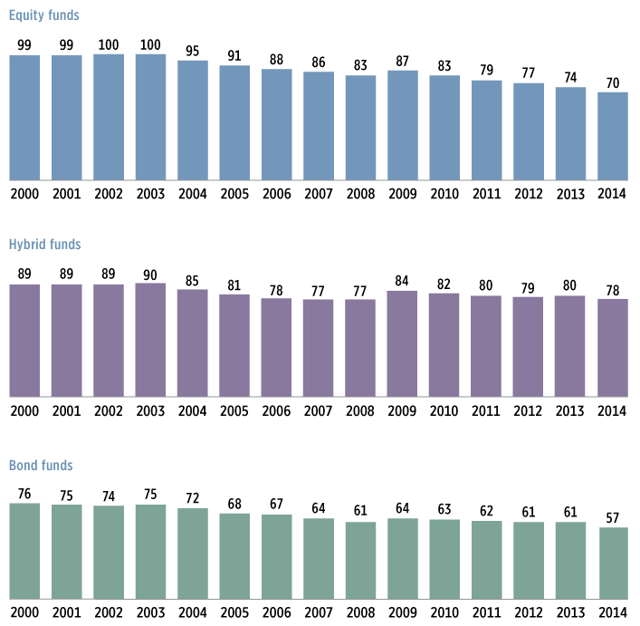
We generally expect the market's level to rise over longer periods of time, but it's important to be aware of the potential for near-term volatility impacting business results. Pressure on fee revenue is a bigger long-term concern. As seen below, in 2000, equity fund investors incurred expense ratios of 99 basis points, on average, or 99 cents for every $100 invested. By 2014, that average had fallen to 70, a decline of 29%. The average bond fund fee fell by more than 20% over this time period as well. The rise of lower-cost passive investment vehicles and generally disappointing performance of active managers are driving this trend.
(click to enlarge)
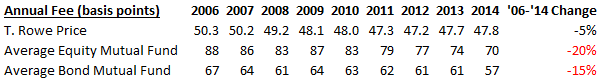
As we mentioned earlier, TROW has offered lower fees for quite some time, enhancing its performance and increasing client retention. As seen below, TROW's average annual fee has fallen just 5% from 2006 to 2014 compared with declines of more than 15% across the rest of the industry. We believe the firm's superior performance numbers and still-reasonable fee level will allow it to maintain its fees at similar levels.
Funds that track the performance of a particular index, rather than trying to beat it, have gained in popularity over the last five years. Exchange-traded funds (ETFs) are primarily managed passively and are traded on exchanges, unlike mutual funds. ETFs and passively-managed products offer much lower fees and have increased from about 10% of industry revenue in 2010 to nearly 15% in 2015.
The active managers most at risk of having their businesses taken by ETFs are those with below-average performance, portfolios that closely mirror their benchmarks, and less-proven reputations. This is especially true as investors have access to more information than ever before, making fund performance and fee comparisons easier than ever. We believe these trends could drive consolidation in the fragmented active management industry, driving more business to larger, more reputable funds like TROW.
To put some numbers behind the rise in passive management, according to the Morningstar Direct U.S. Asset Flows Update, passive US equity funds saw inflows of $167 billion, while active U.S. equity funds lost $98 billion in 2014. Passive U.S. equity inflows have surpassed all other equity categories for the last three years. As seen below, well under half of active funds have outperformed their passive counterparts over most time periods during the last decade. When coupled it the industry's extremely high profit margins, many of these laggards will likely remain under intense fee and asset outflow pressure.

We believe TROW has less exposure to these risks thanks to its oversized exposure to stickier retirement assets, its long-term and short-term outperformance relative to peers, long-standing industry reputation for quality, and breadth of funds.
Dividend Analysis
We analyze 25+ years of dividend data and 10+ years of fundamental data to understand the safety and growth prospects of a dividend. TROW's long-term dividend and fundamental data charts can all be seen here and support the following analysis.
Dividend Safety Score
Our Safety Score answers the question, "Is the current dividend payment safe?" We look at factors such as current and historical EPS and FCF payout ratios, debt levels, free cash flow generation, industry cyclicality, ROIC trends, and more. Scores of 50 are average, 75 or higher is very good, and 25 or lower is considered weak.
TROW recorded an excellent Safety Score of 99, suggesting its current dividend payment is one of the safest available in the market. The company's moderate payout ratios, debt-free balance sheet, and sticky client relationships support the favorable ranking.
Over the trailing twelve months, TROW's dividend has consumed 43% of its GAAP earnings and 41% of its free cash flow. Since TROW's operations are sensitive to movements in the market, it's important for the company to maintain flexibility with its payout ratios. If earnings and free cash flow were to drop by 30% again like they did during the financial crisis, TROW's payout ratios would increase to around 60% (similar to what happened during 2008-09).
Looking at longer-term trends in payout ratios can be even more helpful. Our dividend tools let you view a stock's EPS and free cash flow payout ratios over the last decade. As seen below, TROW's payout ratios have generally remained below 40%.


Source: Simply Safe Dividends
For dividend companies with enough operating history, it's always a prudent exercise to observe how their businesses performed during the financial crisis. Our Stock Analyzer tool lets us see how a company performed during the financial crisis in one click. TROW's reported sales fell 5% in fiscal year 2008 and 12% in fiscal year 2009, but its earnings and free cash flow retreated by about 30%, reflecting the high operating leverage in TROW's business model (i.e. assets shrink, but its technology infrastructure and employee costs are more fixed in nature).

Source: Simply Safe Dividends
High quality companies are able to generate cash flow year in and year out. Rising cash flow is very important because it supports continued dividend growth without expanding the payout ratio. As seen below, TROW has generated healthy free cash flow each of the past 10 years. The asset management industry operates with a very low level of capital intensity, throwing off tons of cash - for every dollar spent on wages, IBISWorld estimates that only $0.05 goes to capital investment.

Source: Simply Safe Dividends
While payout ratios, margins, industry cyclicality, free cash flow generation, and business performance during the recession help give us a better sense of a dividend's safety, the balance sheet is an extremely important indicator as well. When times get tough, a healthy balance sheet can continue funding a company's dividend.
TROW has one of the best balance sheets you will find. The company has no debt and more than $1.2 billion of cash on hand. TROW also generates substantial free cash flow, throwing off $1.1 billion last year. Should investor preferences shift even more rapidly into passively-managed products, TROW has the reputation and financial firepower to invest in or acquire the necessary operations to remain relevant for a long time to come.

Regardless of how markets perform over the coming year, TROW's dividend is very safe. Payout ratios are below 50%, the company has zero debt, free cash flow generation is very strong, and the company's investment fund performance is solid across the board.
Dividend Growth Score
Our Growth Score answers the question, "How fast is the dividend likely to grow?" It considers many of the same fundamental factors as the Safety Score but places more weight on growth-centric metrics like sales and earnings growth and payout ratios. Scores of 50 are average, 75 or higher is very good, and 25 or lower is considered weak.
TROW's Growth Score is 94, meaning its dividend's growth potential ranks higher than 94% of all other dividend stocks we monitor. The company's sub-45% payout ratios, debt-free balance sheet, $1+ billion annual free cash flow generation, above-average investment fund performance, and heavy exposure to retirement-related products support a healthy outlook for continued earnings and dividend growth.
TROW raised its quarterly dividend by 18% earlier this year and has increased its dividend each of the last 25 consecutive years, making itone of the 52 stocks in the Dividend Aristocrats Index. By calendar year, TROW has increased its dividend payments by 15% per year over the 10-year period ending on 12/31/14 and has maintained a double-digit annual growth rate over the last 3- and 5-year periods as well. We believe double-digit dividend growth can continue for quite some time.

Valuation
TROW trades at about 14x forward earnings and appears to reflect some of the anxiety investors' have about the market's current level and volatility over the past month. While the stock would likely underperform in the event of a dramatic bear market, it would not change our expectations for the company to deliver close to 10% annual earnings growth longer time periods. When coupled with the stock's current 3% dividend yield, long-term dividend growth investors could be looking at a stock with 13% annual total return potential. Not bad at all for a company of TROW's high quality level.
The stock's dividend yield is 3.0%, good for a Yield Score of 55. This means that TROW's dividend yield is higher than 55% of all other dividend-paying stocks, making it one of the more attractive dividend growth stocks. With safe payout ratios, a debt-free balance sheet, sticky client relationships, and consistent free cash flow generation, we believe the stock trades at a reasonable price for long-term dividend growth investors.
Conclusion
TROW will ebb and flow with the market's movements over short-term time periods, but the stock appears to be trading at a reasonable valuation today for long-term dividend growth investors. While the actively-managed fund industry is facing fee pressure and loss of market share to passively-managed products and ETFs, TROW's top quartile performance, large scale, strong brand, and higher mix of retirement-related accounts position the company well for continued growth. We believe this dividend aristocrat has a long ways to run.
Disclosure: We are long TROW.


