The Surprising Outperformance Of A Value-Tilted Strategy In 2017
2017 was the year of growth over value—year-to-date through December 1st, the S&P 500 Growth Index outperformed the S&P 500 Value Index by essentially double the return, or a 1,300 basis point (bps) spread.
Year-to-Date Total Returns of Value vs. Growth
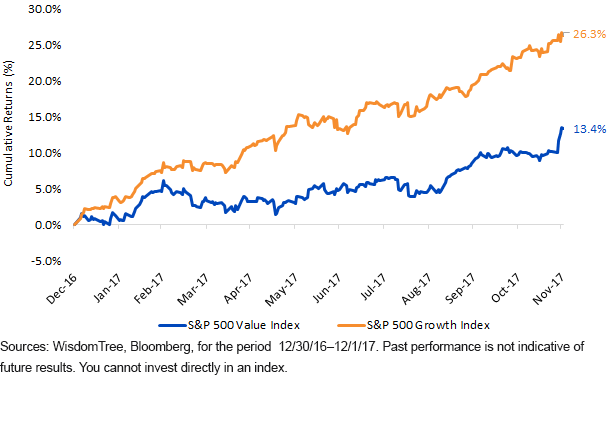
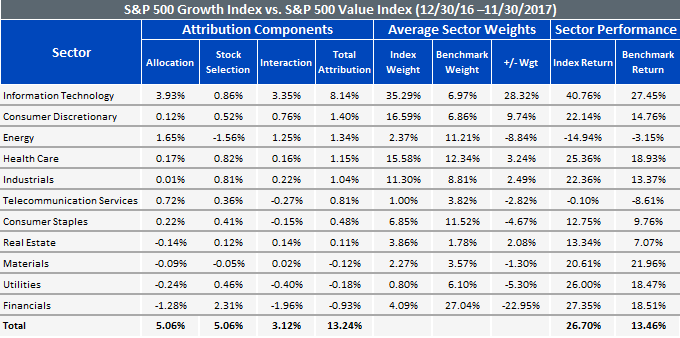
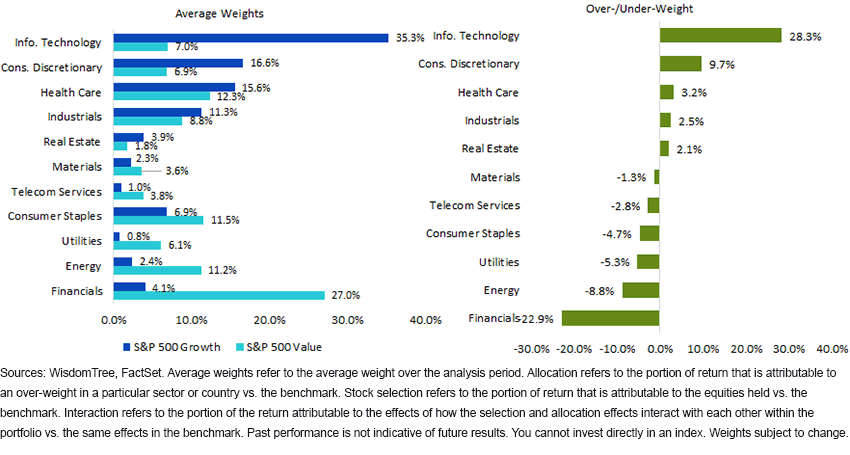
This performance advantage for growth investing largely stemmed from an over-weight in the Information Technology sector—approximately 800 bps of the differential was driven by Information Technology, with the other 500 bps or so coming from a combination of over-weights in Consumer Discretionary, under-weights in Energy and better Health Care stock returns.
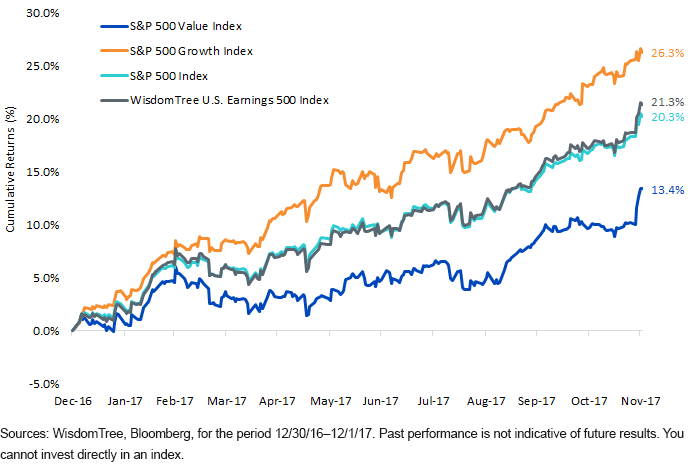
WisdomTree conducts an annual rebalance of its earnings-weighted family every December. This once-a-year process incorporates a rules-based discipline to sell what is becoming more expensive on a price-to-earnings (P/E) basis and buy what is becoming cheaper on that basis. This, by definition, incorporates an element of anti-momentum trading and valuation tilting to lower-priced segments of the market. With this headwind of value lagging growth considerably, you would think this was a difficult performance environment for the WisdomTree U.S. Earnings 500 Index.
Returns-based style analysis shows a best-fit regression model for the WisdomTree U.S. Earnings 500 Index would be allocated 61% to the S&P 500 Value Index and 36% to the S&P 500 Growth Index, showing a clear value tilt.
But reviewing year-to-date returns through December 1st, the WisdomTree Earnings 500 Index outperformed the market. What is going on here?
Year-to-Date Total Return Comparison
One key differential in the traditional value index and the WisdomTree U.S. Earnings 500 Index: the Information Technology sector was a drag on this index, as more expensive Information Technology stocks led the way higher. But unlike the S&P 500 Value Index, which only had 7% Information Technology, the WisdomTree U.S. Earnings 500 Index had its biggest sector exposure in Information Technology and only a modest 90 bps under-weight in the S&P 500.
The biggest addition to value add came from under-weights in the Energy sector.
-vs,-d-,-s,-a-,p-500-index.gif?la=en&hash=9D3414BC1C3D4A863C7B064E84BC011BF8CA7B7D)
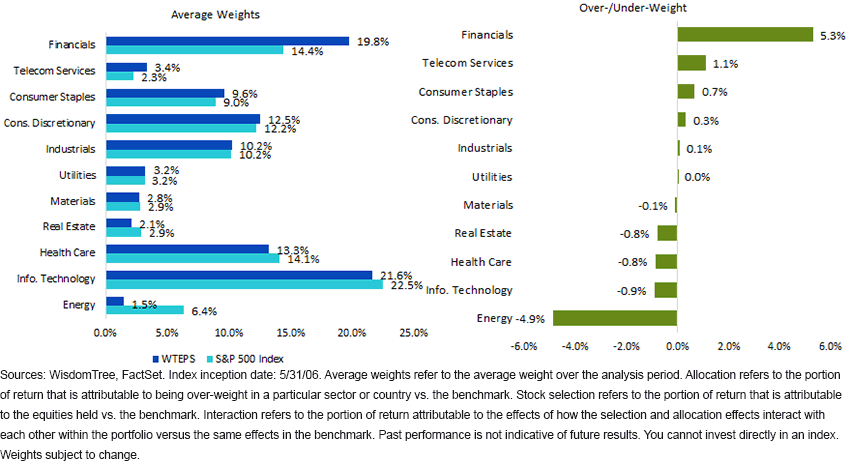
Rebalancing Sector Exposures
This Index rebalanced in the middle of December, and Energy stocks both had the worst returns but also growth in earnings this year off a low base, so Energy was the sector whose weight was primed to increase the most in the Index.
Information Technology stocks, which actually had the strongest performance, also saw really strong growth in earnings, so the weight of Information Technology was flat in this Index. This is some validation to its very strong gains in market prices that, as a group, weight was sustained in this high-performing sector.
Otherwise, changes to the Index at the rebalance were relatively modest.
We believe valuation-oriented rebalancing becomes increasingly important as market multiples rise. This defines the market environment we’ve had over the last seven or eight years. If you are concerned with the S&P 500 P/E ratio approaching 23x,1 a post-rebalance P/E ratio of the WisdomTree U.S. Earnings 500 Index has a price-to-earnings ratio of 18x to 19x earnings before any tax-related impacts. This is a reasonable price for a broad-based strategy of U.S. large caps, in our view.
1Sources: WisdomTree, FactSet, as of 11/30/17.
Disclaimer: Investors should carefully consider the investment objectives, risks, charges and expenses of the Funds before investing. U.S. investors only: To obtain a prospectus containing this ...
more


