The Most Volatile Stocks On Earnings - Wednesday, Oct. 4
The start of the new quarter brings with it the start of another earnings season, and next week is when we’ll start to hear from companies reporting their Q3 2017 earnings. As we do prior to the start of each earnings season, in this post we update our list of the most volatile stocks on earnings.
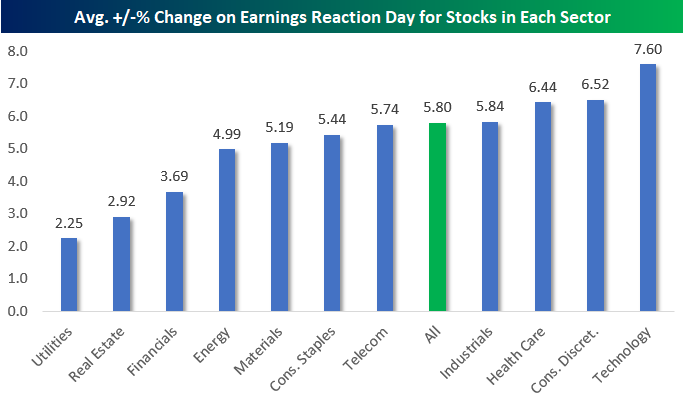
Below is a look at how volatile stocks are on earnings by sector.Since 2001, US stocks have experienced an average move of +/-5.80% on their earnings reaction day. This means that quarterly earnings reports typically result in a change in market cap of +/-5.8% for public companies. But some sectors are more volatile than others of course. As shown in the chart, Tech stocks that reports earnings typically move an average of +/-7.60% on their earnings reaction day. Conversely, the average stock in the Utilities sector only moves +/-2.25% on earnings.It’s not surprising that Tech stocks are 3x as volatile as Utilities stocks when it comes to earnings reactions, but these numbers help to quantify the differences.
Generally speaking, stocks in the Utilities, Real Estate, and Financial sectors move the least on earnings, while Technology, Consumer Discretionary, and Health Care stocks move the most.

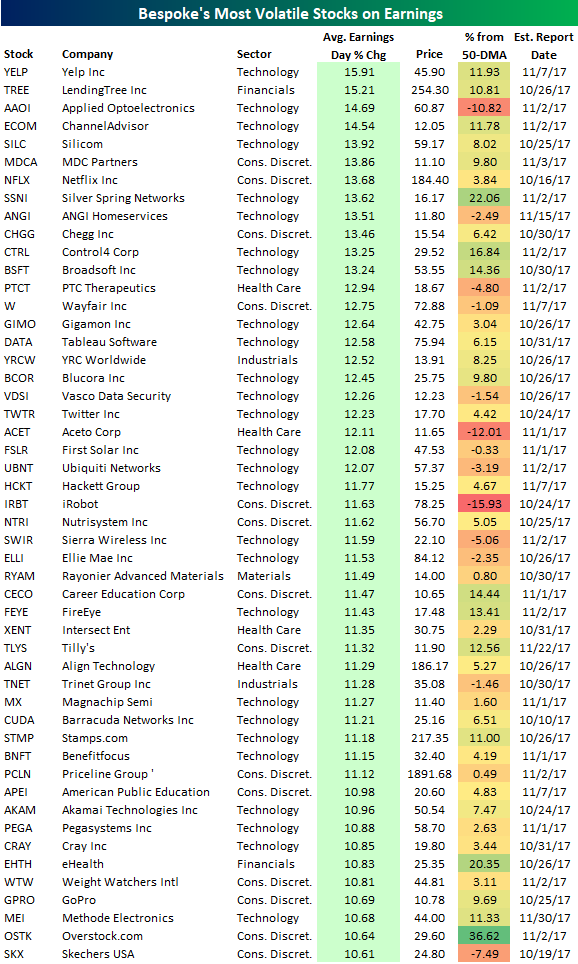
As shown, Yelp (YELP) is the most volatile stock on earnings with an average one-day change of +/-15.91%. LendingTree (TREE) ranks second and is the only other stock that typically moves more than +/-15%. Applied Opto (AAOI), ChannelAdvisor (ECOM), and Silicom (SILC) round out the top five.
Netflix (NFLX) is the most well-known stock in the top ten with an average one-day change of +/-13.68% on earnings. Other notable names on the list include Wayfair (W), Tableau Software (DATA), Twitter (TWTR), First Solar (FSLR), FireEye (FEYE), Priceline (PCLN), and GoPro (GPRO).
One final note.In the table below we’ve also included how far each stock is currently trading from its 50-day moving average. Heading into earnings season, there are a lot of stocks trading significantly above their 50-day moving averages (overbought). For stocks on the list with prices that are extended to the upside, expectations are going to be quite high for earnings. Failure to meet these lofty expectations will likely result in significant pain for investors. The reverse is true for stocks that are trading well below their 50-day moving averages.

Disclaimer: To begin receiving both our technical and fundamental analysis of the natural gas market on a daily basis, and view our various models breaking down weather by natural gas demand ...
more


