
The Longer Term Outlook
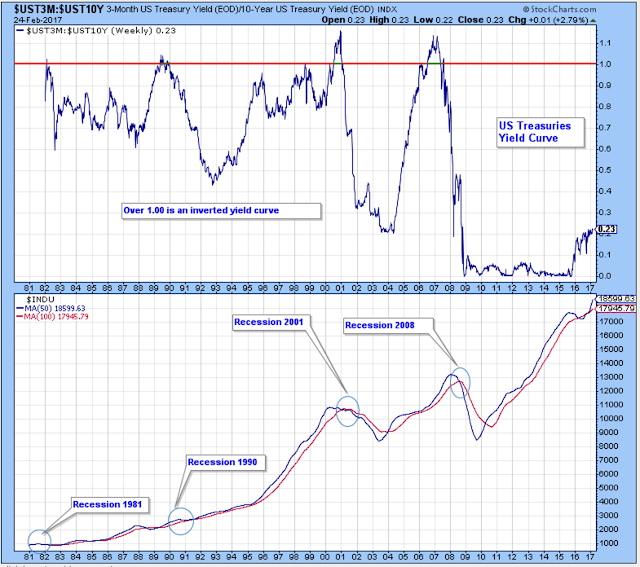
This chart shows that the last four recessions coincided with an inverted yield curve, and, at the moment, the yield curve is far from inverted.
So should we conclude that rates favor higher stock prices? I don't think it is as simple as this chart would suggest. I worry that the small increases in short-term rates could have much more of an impact on the economy than they did in past cycles. And, with valuations so extended, higher rates could push down stock prices.
But let's not overthink this. For now, this yield curve is a data point that favors the economy and stock prices.
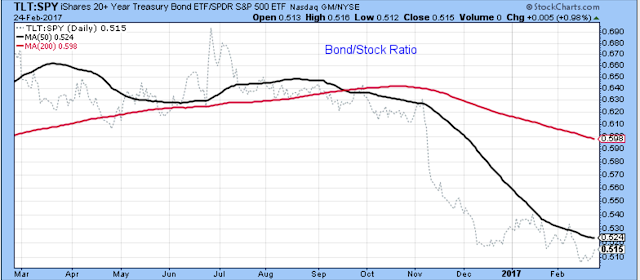
Here is a look at the bond / stock ratio. Last summer this ratio broke down for bonds, and has been highly favorable for stocks ever since.
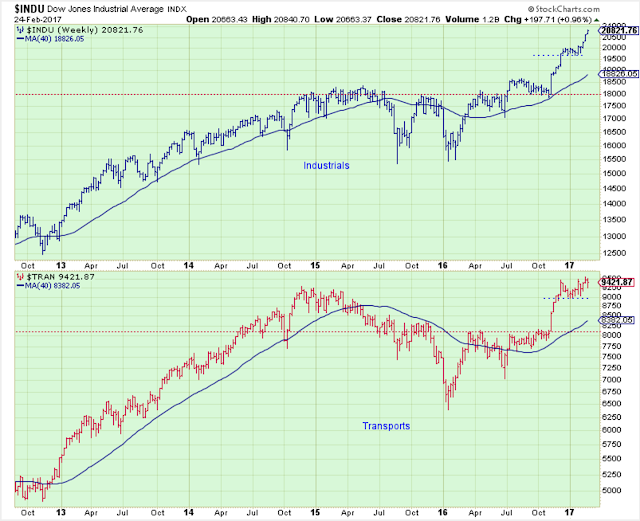
The Dow indexes are aligned for higher stock prices. There is some short-term concern, though. The Industrials are reaching for new highs, but the Transports have stalled. Based on this chart, I don't think it would surprise anyone to see the Industrials retest the 20,000 level.
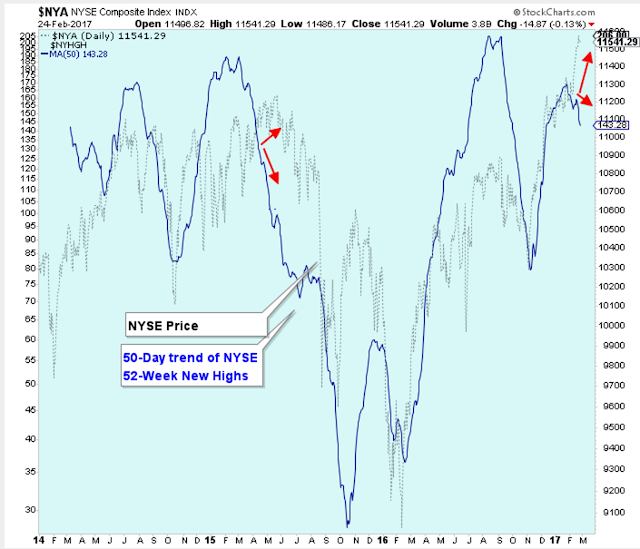
This chart showing the 50-day trend of new highs has recently headed south and isn't confirming stock prices. This is a concern and worth watching, but it is way too early to make too much of this. For now, I think it is just more evidence that the short-term is in need of consolidation after such a strong run up in prices.
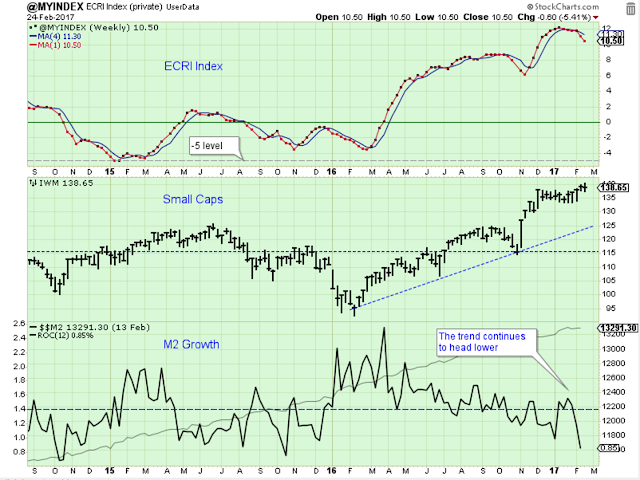
Below is my favorite chart. The ECRI is at a very healthy level, and small caps are doing their part to confirm.
M2 growth is now a concern, though. The latest data point is weak and has fallen below the mid range after a steady decline for months.
Bottom line: The two top panels of this chart continue to favor higher stock prices longer-term, but the lower panel indicates that stock prices may have their ups and downs in the coming months.
Sectors
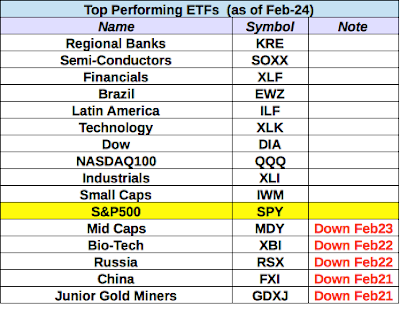
Below is the spreadsheet with ETFs that are still outperforming SPY, along with the ETFs that have fallen below SPY this past week.
Please remember that this is a blog and I am recording my own thoughts on these ETFs. In other words, this is how I am handling my own account. You have to decide for yourself how you handle your account.
Also, just because an ETF is starting to under-perform SPY, it doesn't mean that it is to be sold. For instance, Mid Caps are starting to under-perform in my judgment, but the chart still looks good and I don't see a signal to sell.
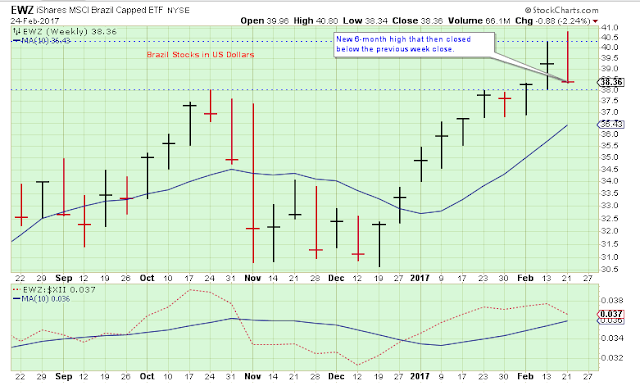
Brazil had a rough week after touching a new high. It then reversed and closed near the weekly low which was also below the previous week close. But it is near the important break out level, and also well above the 10-week average.
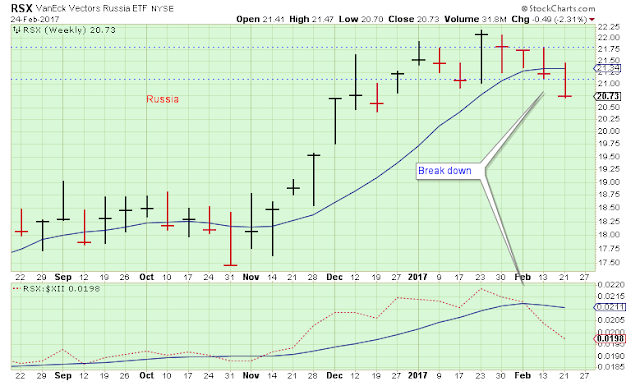
Russia broke down this past week.
Follow Up
The long-term outlook is positive.
The medium-term trend is up.
The short-term trend is up.
Both the short and medium-term trends look like they are close to peaking.
Disclaimer: I am not a registered investment advisor. My comments above reflect my view of the market, ...
more


thanks for sharing
thanks for sharing