
The Importance Of ROIC
Return on invested capital, or ROIC, is a profitability ratio telling us how efficient a company is turning capital into profit. It measures the return that an investment generates for those who have provided capital (i.e., bondholders and stockholders).
The general equation is: ROIC = NOPAT / (Debt + Equity).
By linking income statement and balance sheet together, ROIC is the best measure of management performance and the primary driver of equity returns. Empirical research shows that stocks of high ROIC companies tend to outperform significantly those of less profitable firms, regardless of the market climate. I give the ROIC factor the highest weighting for my factor-based stock fundamental ranking system.
ROIC vs. P/E (Earning Growth)
Per the chart below and many other studies, the correlation between EPS growth and valuation is almost non-existent. That is, high-growth companies may have low P/E while low-growth companies may have high P/E. In fact, the r-squared value of 0.0006 in the chart shows that previous 5-year EPS growth explains less than one-tenth of one percent of the difference in prices (and hence, returns) between stocks in the S&P 500.
EPS Growth Has Almost No Impact On Valuation
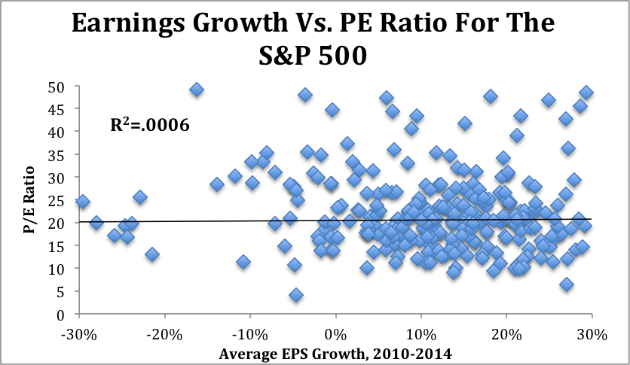
Source: New Constructs, LLC.
In the meantime, ROIC explains nearly two-thirds of the difference in shareholder returns between various companies.
ROIC Is The Primary Driver Of Stock Price
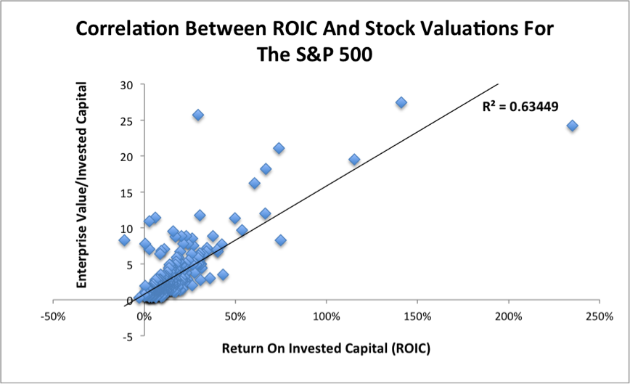
Sources: New Constructs, LLC
You may be wondering why previous earning power is not a good predictor of future stock returns. One major factor could relate to the sustainability of performance metrics (i.e., less sustainable high growth rate vs. more sustainable high ROIC) since current stock price essentially reflects the present value of future business performance.
According to a study conducted by McKinsey & Company on publicly-traded American businesses, no matter how high (or low) a company's previous/current growth rate, over time growth has historically converged to about 5% (see the chart below).
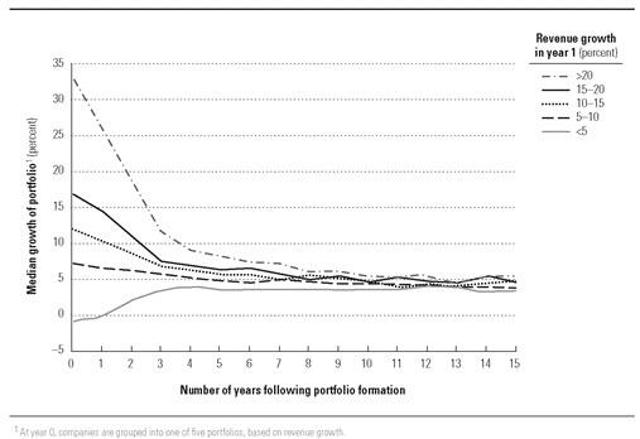
Source: Valuation by McKinsey & Company.
It is worth noting from the chart that businesses with the highest current growth rate would very likely decelerate most over the next couple of years. This rapid rate at which growth "decays" to average is a primary reason why investors should think twice before paying high prices for quickly-growing companies. Of course, there must be some high-growth businesses that continue to maintain high growth for a decade or more, but the difficulty and likelihood of achieving so should always be carefully examined by investors.
Conversely, the similar research by McKinsey demonstrates a smaller level of decay at a slower pace for ROIC (see the chart below). For instance, top performing firms returning 25% or more returns on invested capital would very likely see their ROIC persist at above 15% (vs. average ROIC of 10% among U.S. companies) over the very long run. Therefore, a business with a high ROIC deserves a high price multiple, making ROIC a more trustworthy predictor.
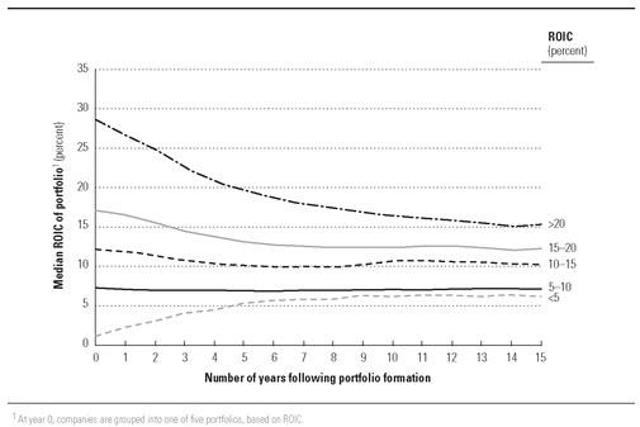
Source: Valuation by McKinsey & Company.
ROIC vs. ROE
I know many investors like to use ROE (Return on Equity) as the measurement to predict stock performance, as it is intuitive for shareholders to gauge how efficient the management allocates equity capital to generate returns.
However, a company with high leverage typically will have much higher ROE than a company with no leverage, but this advantage is a result of the capital structure instead of actual business performance. At the end of the day, debt can work for or against you (as equity investors), depending on whether management turns that money into reasonable profits. Therefore, ROE may give you a false picture. Instead, ROIC is a much better alternative performance metric to find quality investments as it measures the return on all invested capital, including the debt-financed capital.
Let's take a look at Coca-Cola (KO) and Monster Beverage (MNST), both of which are in the beverage sector. While KO has higher ROE of over 25% (vs. below 20% at MNST) for the past couple of years, MNST achieved better ROIC of over 15% (vs. around 10% at KO). A closer look (see the table below) tells us that KO increased its financial leverage recently, resulting in lower interest coverage, higher debt-to-equity, and of course, "artificially" higher ROE (even when its margin, asset turnover, and ROIC have all come down).
Profitability of Coca-Cola
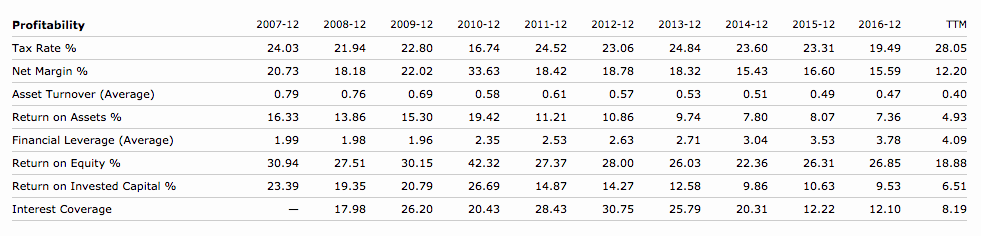
Source: Morningstar.
On the contrary, MNST did not have any debt on its balance sheet; as a result, its ROIC is quite close to its ROE (see the table below). Monster Beverage's management demonstrated better skills of efficiently allocating capitals (from both equity and debt investors) even though its ROE is lower than that of KO. MNST outperformed KO by a wide margin during the past two years (55% vs. 2%).
Profitability of Monster Beverage
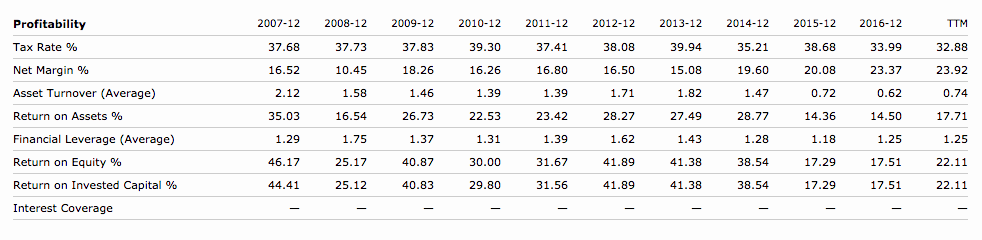
Source: Morningstar.
MNST outperformed KO during the past two years
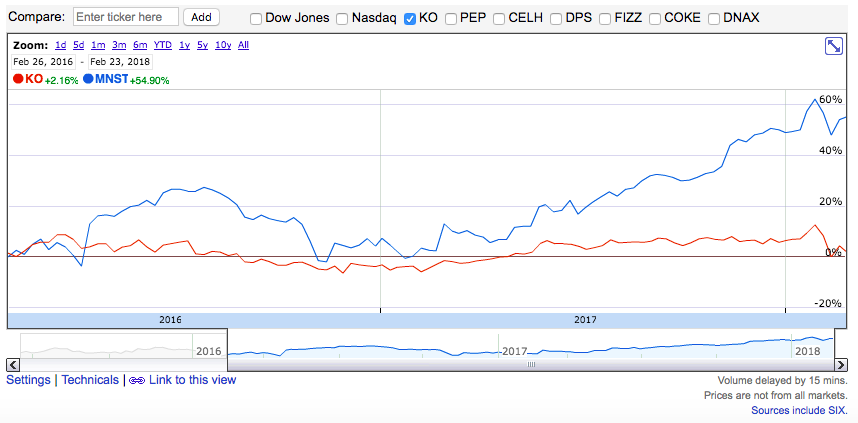
Source: Google Finance; Data as of 2/26/2018.
Below is the list of some stock picks of consistently high ROIC (at least 15% over the past decade) businesses along with their 5-yr stock performance.
| ROIC Range (over the past decade) | 5-yr Performance (excluding dividends) | |
|---|---|---|
| SEIC | 17%-28% |
159.77% |
| ROST |
24%-44% |
171.22% |
| AAPL |
20%-42% |
172.52% |
| ROL |
26%-32% |
209.75% |
| FDS |
29%-49% |
109.66% |
| PAYX |
31%-41% |
100.69% |
| NKE |
17%-28% |
150.18% |
| LSTR |
18%-30% |
100.25% |
| PETS |
19%-32% |
262.24% |
| GILD |
18%-55% |
90.6% |
| MTD |
20%-32% |
199.36% |
| OFLX |
15%-45% |
303.84% |
| ATRI |
15%-20% |
175% |
| USNA |
32%-59% |
244.67% |
Source: Morningstar & Google Finance; Data as of 2/26/2018.
All the above stocks outperformed S&P 500 (81.3%, excluding dividends) over the past five years. They also earn high scores from my factor-based value investing ranking algorithm.
Summary
ROIC should be the No. 1 factor for stocks to generate alpha over the long haul. It is superior to P/E, growth rate and even ROE for the reasons outlined above. Research shows that high ROIC stocks would very likely outperform the benchmark throughout both bull and bear markets.
Feel free to comment below if you favor any high ROIC company not mentioned above.
Disclosure: I am long AAPL, FDS, MNST, GILD, ROL, SEIC, PAYX, NKE.


Really enjoyed this. Hope to read more by you.
Thanks for the comment! Appreciate it.
Any time, keep the articles coming.