
Stock Market Volatility Reflected In ETF Flows As Investors Brace For 2019
Stock Market Talking Points:
- In late December, SPY, IVV and VOO funds saw assets under management climb the most on an intraday basis since February
- Flows also reveal that many ‘dip-buyers’ are being burned
- Investors shifted more capital in December than in seven of the previous eight months, with October as the outlier
STOCK MARKET VOLATILITY REFLECTED IN ETF FLOWS
The week was a mixed basket for the US stock market. After Apple revised earnings on Thursday, investors were filled with fear of a China slowdown. Luckily for bulls and 401K accounts alike, traders rode positive employment data to a strong close on Friday to end the week 1.86% higher.
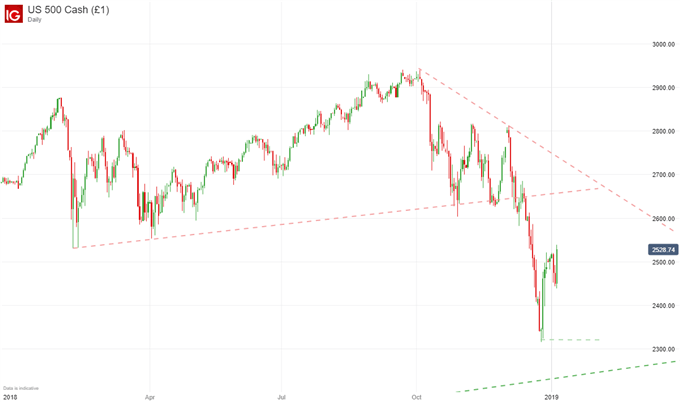
S&P 500 Price Chart Daily, 2018 to January 4th, 2019 (Chart 1)
According to fund flows from SPY, IVV and VOO, investors bought the dip in earnest on December 21st. $7.4 billion was allocated to the three baskets and marked the largest single day inflow since mid-February 2018 when investors poured nearly $8 billion into the funds on a single day. The inflows preceded a late December rally and some investors were able to pick up some nice profits as others once again reduced their position.
Aggregate Fund Flows for Broad Market ETFs versus S&P 500 Performance (Chart 2)
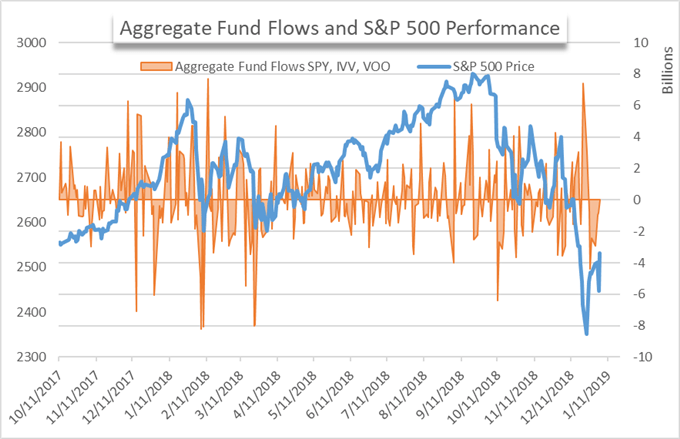
Compared to the dips for the S&P 500 in October and November, the magnitude of inflows seen during December may suggest traders see an attractive buying opportunity near the 2400 range. Upon multiple tests at the 2600 level, inflows were seen but sentiment and fundamental factors seem to have overpowered dip-buyers.
Further reading: Our first quarter forecasts for equities, commodities and currencies.
At this new level however, bulls may have had enough. If the index slips below 2400 again, look for conviction in fund flows. While flows alone are not a surefire indicator, they can be a useful tool in your analysis arsenal. From a technical perspective, a trendline from 2009 rests narrowly below the recent bottom. If buyers are less earnest next time the level is tested, expect the nearby trendline to be the next level of support.
The 2009 trendline also carries with it a great deal of sentimental meaning. Since its origination is the depths of the Great Financial Crisis and it has held throughout the current decade-long bull run, a break below would shatter morale for many speculators and investors. Coupled with the recent yield curve inversion, the two factors may pull the rug out from underneath the market and result in a full stock market crash.


