
Nasdaq Reports Second Quarter 2017 Results; Achieves Record Quarterly Net Revenues
- Net revenues1 were a record $602 million in the second quarter of 2017, an increase of 8% compared to the second quarter of 2016. Subscription and recurring revenues2increased 5% compared to prior year period and represented 75% of total net revenues in the second quarter of 2017.
- Second quarter 2017 GAAP diluted EPS was $0.87, while non-GAAP diluted EPS was $1.02.3 Compared to the second quarter of 2016, GAAP diluted EPS increased $0.45, or 107%, while non-GAAP diluted EPS increased $0.11, or 12%.
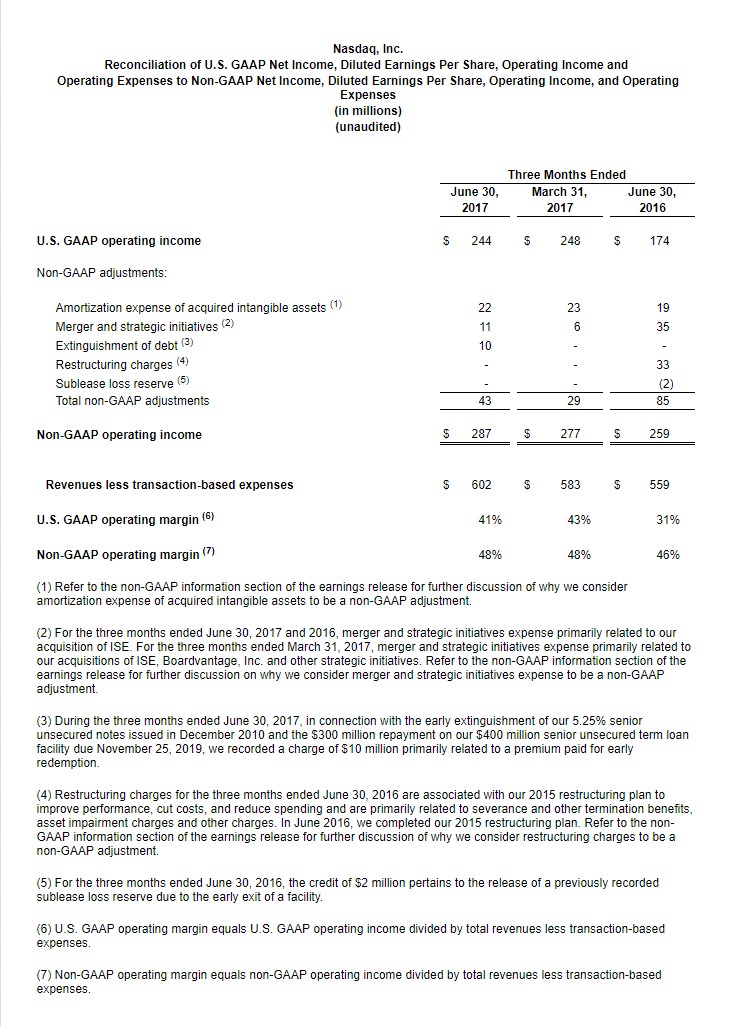
- GAAP operating margin increased to 41% in the second quarter of 2017, up from 31% in the second quarter of 2016 while non-GAAP operating margin rose to 48% in the second quarter of 2017, up from 46% in the second quarter of 2016.
- As of June 30, 2017, the company achieved $60 million in annualized run-rate cost synergies. The company has also identified $10-$20 million in additional synergies to be realized upon completion of various platform migrations.
- The company is lowering its 2017 non-GAAP operating expense guidance to $1,260-$1,290 million.
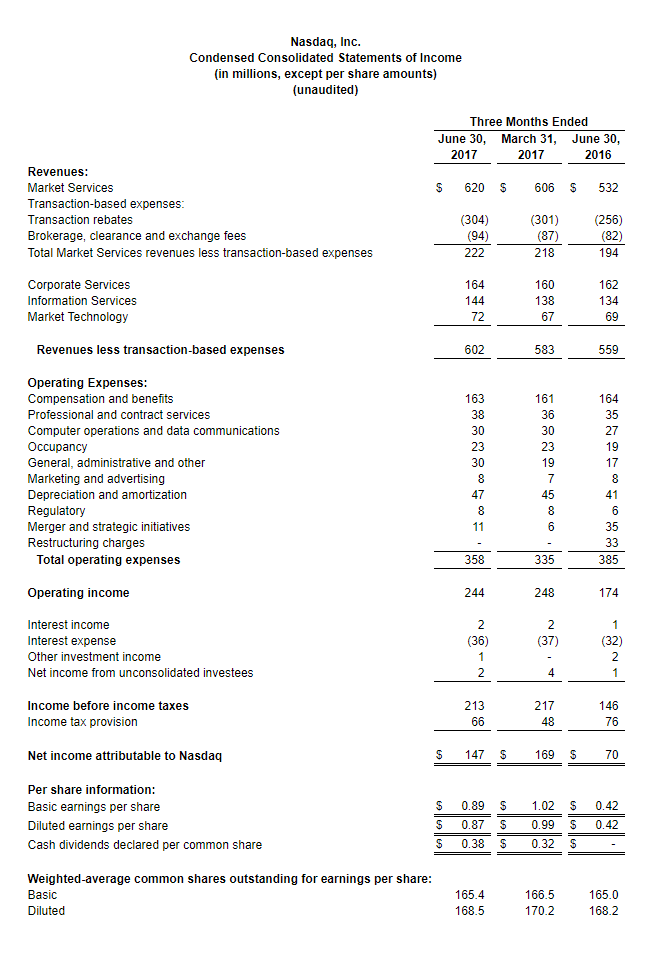
NEW YORK, July 26, 2017 (GLOBE NEWSWIRE) -- Nasdaq, Inc. (Nasdaq:NDAQ) today reported financial results for the second quarter of 2017. Second quarter 2017 net revenues were $602 million, up $43 million or 8% from $559 million in the prior year period. The second quarter increase in net revenues included a $34 million positive impact from acquisitions and $15 million, or 3%, organic growth, partially offset by a $6 million unfavorable impact due to changes in foreign exchange rates.
“In addition to achieving a new quarterly net revenue record, we are making significant progress against our 2017 execution priorities, by commercializing key technologies with new products available through the Nasdaq Financial Framework and Analytics Hub, achieving our merger synergies ahead of our original timeline, and raising our market share in our largest trading categories significantly above prior year levels,” said Adena T. Friedman, President and CEO, Nasdaq.
Mrs. Friedman continued, "At the same time, we have taken a leadership role supporting current and potential corporate issuers through our blueprint to revitalize the U.S. capital markets,4 which champions reforms and initiatives that we believe improve the public company experience to the benefit of stakeholders throughout and even beyond the broader investment community.”
1 Represents revenues less transaction-based expenses.
2 Represents revenues from our Corporate Services, Information Services and Market Technology segments, as well as our Trade Management Services business.
3 Refer to our reconciliations of U.S. GAAP to non-GAAP net income, diluted earnings per share, operating income and operating expenses, included in the attached schedules.
4 For more information, please see http://business.nasdaq.com/revitalize
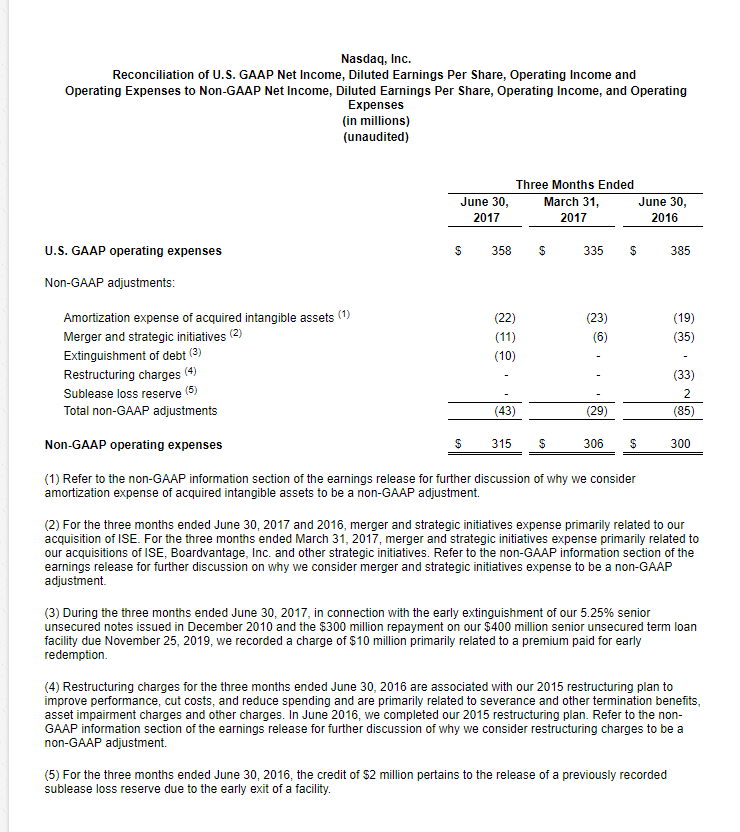
GAAP operating expenses were $358 million in the second quarter of 2017, down $27 million from $385 million in the second quarter of 2016. The decrease primarily reflects lower restructuring and merger and strategic initiatives expense, partially offset by incremental operating expenses from the acquisitions closed in the prior year period and additional costs associated with the early extinguishment of debt.
Non-GAAP operating expenses were $315 million in the second quarter of 2017, up $15 million from $300 million in the second quarter of 2016. This increase reflects $11 million of incremental operating expenses net of synergies from the acquisitions closed in the second quarter of 2016 and a $9 million organic expense increase, partially offset by a $5 million favorable impact from changes in foreign exchange rates.
“Reflecting the significant progress achieved on our integrations and identification of additional opportunities, the company is raising its total synergy target. Despite the headwinds that today's low volatility environment presents, our consistent application of the company's expense and efficiency discipline is delivering margin improvement and contributing to EPS growth consistent with our aspiration to deliver double-digit total shareholder returns," said Michael Ptasznik, Executive Vice President and Chief Financial Officer, Nasdaq.
Mr. Ptasznik continued, "On the capital front, in the second quarter of 2017 we initiated the company's first commercial paper program and began paying down borrowings consistent with our stated objectives, following significant buyback activity and a 19% dividend increase announced in the first quarter of 2017. We plan to continue deploying and returning capital in a thoughtful and balanced approach over time."
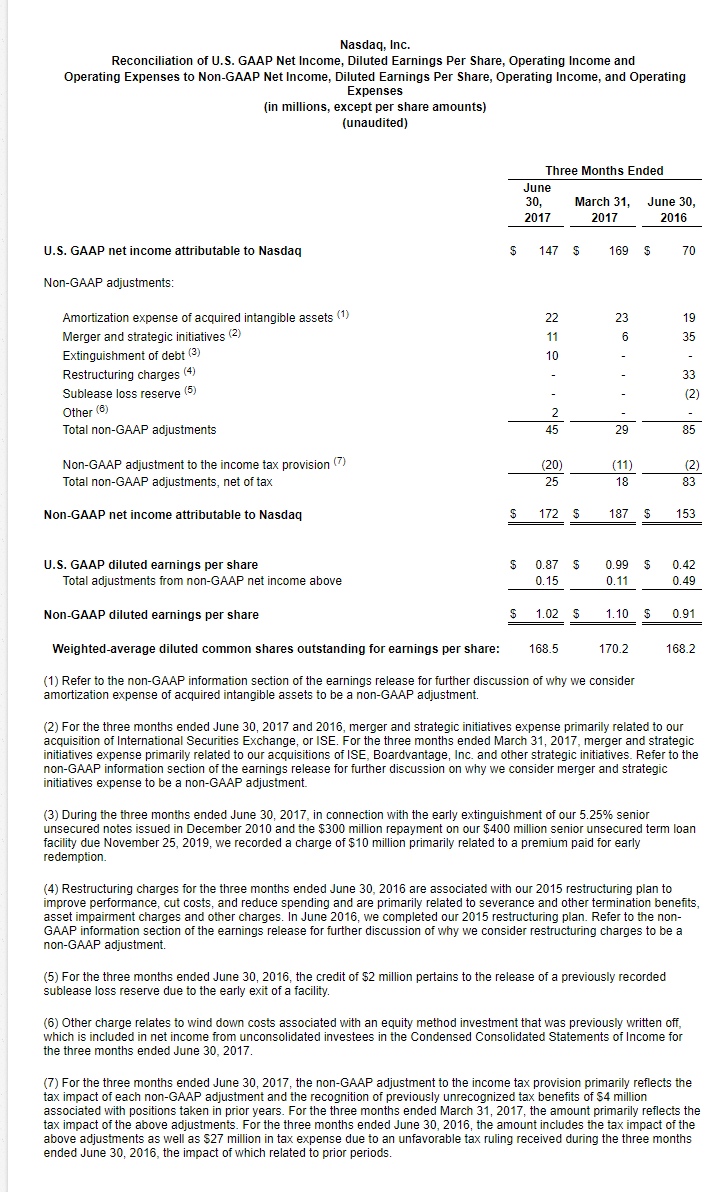
On a GAAP basis, net income attributable to Nasdaq for the second quarter of 2017 was $147 million, or $0.87 per diluted share, compared with net income of $70 million, or $0.42 per diluted share, in the second quarter of 2016.
On a non-GAAP basis, net income attributable to Nasdaq for the second quarter of 2017 was $172 million, or $1.02 per diluted share, compared with $153 million, or $0.91 per diluted share, in the second quarter of 2016.
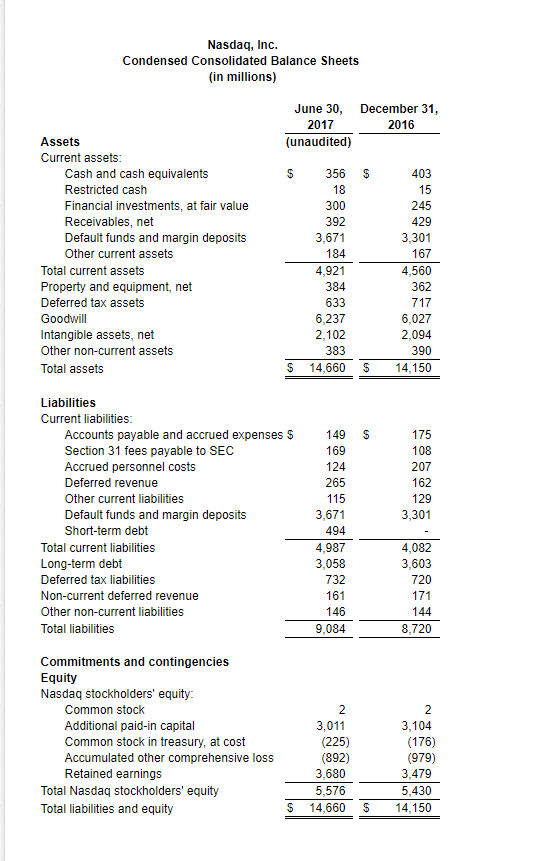
At June 30, 2017, the company had cash and cash equivalents of $356 million and total debt of $3,552 million, resulting in net debt of $3,196 million. This compares to net debt of $3,200 million at December 31, 2016. Included in total debt of $3,552 million is $494 million outstanding from the recently established commercial paper program. As of June 30, 2017, there was $273 million remaining under the board authorized share repurchase program. There were no share repurchases during the second quarter of 2017.
2017 EXPENSE GUIDANCE1 - The company is lowering its 2017 non-GAAP operating expense guidance to $1,260 to $1,290 million, versus prior 2017 expense guidance of $1,260 to $1,300 million.
1 U.S. GAAP operating expense guidance is not provided due to the inherent difficulty in quantifying certain amounts due to a variety of factors including the unpredictability in the movement in foreign currency rates, as well as future charges or reversals outside of the normal course of business.
BUSINESS HIGHLIGHTS
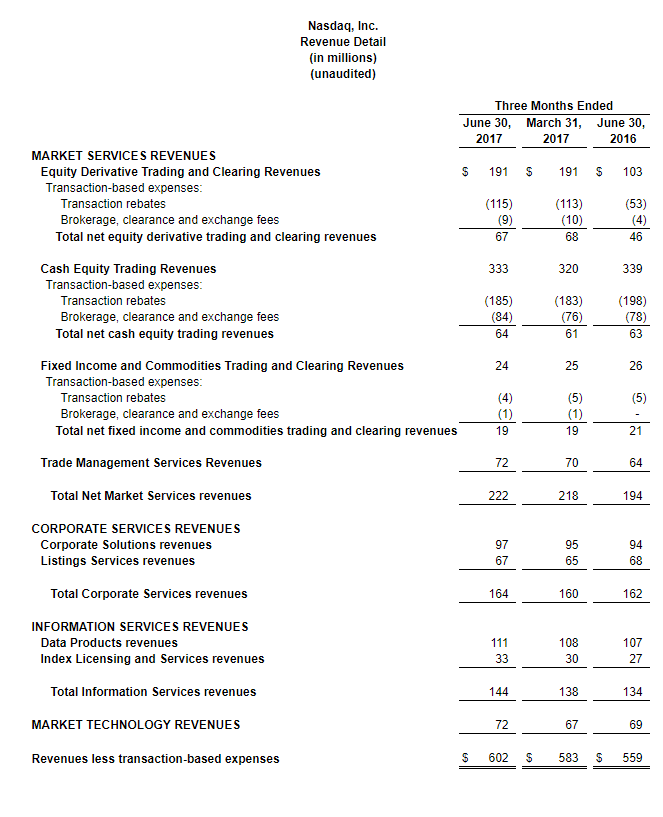
Market Services (37% of total net revenues) - Net revenues were $222 million in the second quarter of 2017, up $28 million when compared to the second quarter of 2016.
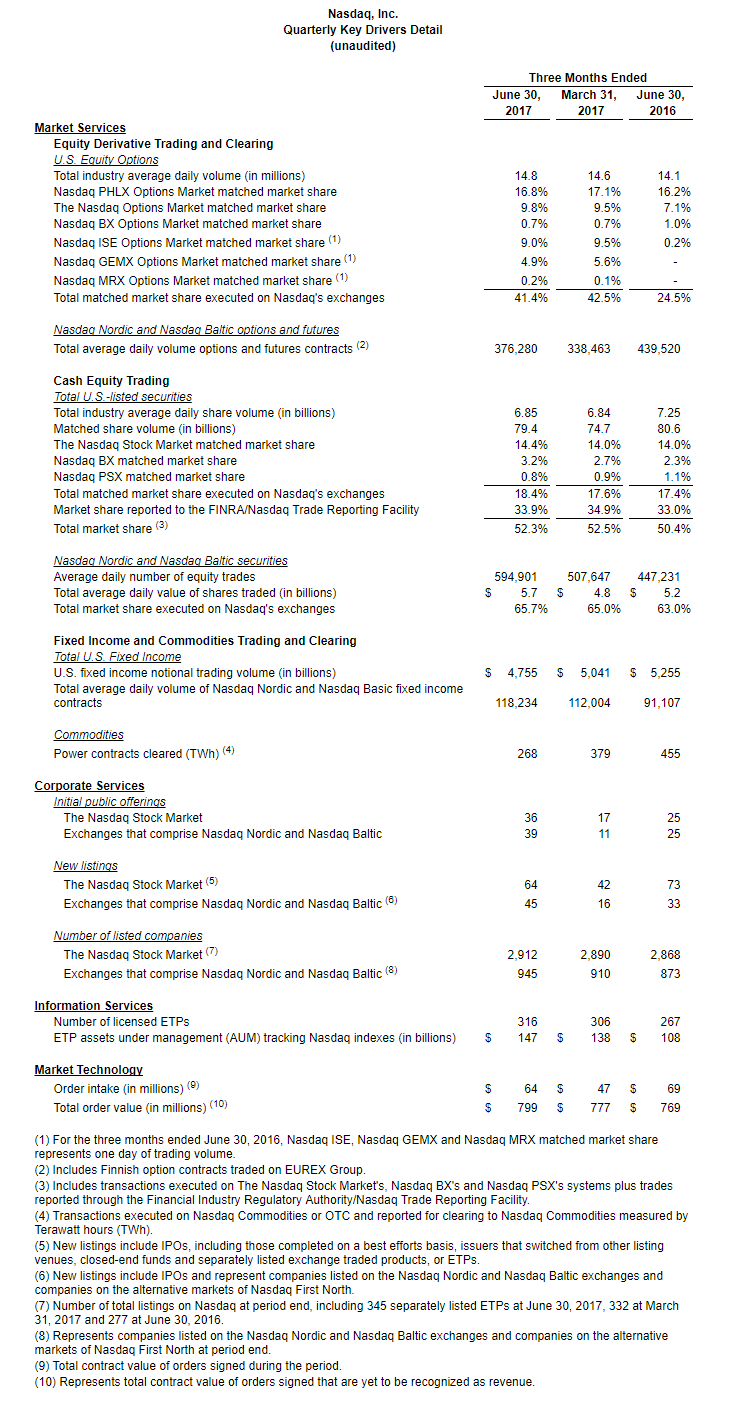
Equity Derivatives (11% of total net revenues) - Net equity derivative trading and clearing revenues were $67 million in the second quarter of 2017, up $21 million compared to the second quarter of 2016. The increase is primarily due to the inclusion of revenues from the acquisition of ISE in June 2016.
Cash Equities (11% of total net revenues) - Net cash equity trading revenues were $64 million in the second quarter of 2017, up $1 million from the second quarter of 2016. This increase primarily reflects higher European cash equities revenues, partially offset by an unfavorable impact from changes in foreign exchange rates.
Fixed Income and Commodities Trading and Clearing (3% of total net revenues) - Net fixed income and commodities trading and clearing revenues were $19 million in the second quarter of 2017, down $2 million from the second quarter of 2016. The decrease primarily reflects lower industry volumes in our European commodities products.
Trade Management Services (12% of total net revenues) - Trade management services revenues were $72 million in the second quarter of 2017, up $8 million compared to the second quarter of 2016, due to the inclusion of revenues from the acquisition of ISE and an increase in customer demand for network connectivity.
Corporate Services (27% of total net revenues) - Revenues were $164 million in the second quarter of 2017, up $2 million compared to the second quarter of 2016.
Corporate Solutions (16% of total net revenues) - Corporate solutions revenues were $97 million in the second quarter of 2017, up $3 million from the second quarter of 2016. The increase is primarily due to the inclusion of revenues from the acquisition of Boardvantage completed in May 2016.
Listing Services (11% of total net revenues) - Listing services revenues were $67 million in the second quarter of 2017, down $1 million from the second quarter of 2016, as an increase in European listing services revenues were more than offset by lower U.S. revenues from the run-off of listing of additional shares fees as a result of the implementation of our all-inclusive annual fee, and an unfavorable impact due to changes in foreign exchange rates.
Information Services (24% of total net revenues) - Revenues were $144 million in the second quarter of 2017, up $10 million from the second quarter of 2016.
Data Products (18% of total net revenues) - Data products revenues were $111 million in the second quarter of 2017, up $4 million compared to the second quarter of 2016 primarily due to growth in proprietary data products revenues.
Index Licensing and Services (6% of total net revenues) - Index licensing and services revenues were $33 million in the second quarter of 2017, up $6 million from the second quarter of 2016 primarily due to higher assets under management in exchange traded products linked to Nasdaq indexes.
Market Technology (12% of total net revenues) - Revenues were $72 million in the second quarter of 2017, up $3 million from the second quarter of 2016. The increase primarily reflects organic revenue growth from software, licensing and support, software as a service, particularly growth in SMARTS surveillance subscriptions, as well as higher change request revenues. New order intake totaled $64 million in the second quarter of 2017 while total order value was a record $799 million at June 30, 2017, up 4% from June 30, 2016.
CORPORATE HIGHLIGHTS
- Nasdaq releases new report outlining call for dialogue and action in U.S. financial markets. The report, "The Promise of Market Reform: Reigniting America's Economic Engine," offers a blueprint to revitalize the U.S. capital markets to create a vibrant ecosystem that delivers enhanced capital formation opportunities, a more inviting environment for growth and innovation, and accelerated job formation and wealth creation. The initiative is designed to create a dialogue and facilitate action steps to help drive America's economic engine by modernizing market structure, reconstructing the regulatory framework and reorienting to a long-term view.
- Market Technology order intake totaled $64 million in the second quarter of 2017 and Nasdaq signed a new agreement to provide a blockchain enabled solution to SIX, the Swiss financial infrastructure provider. Order intake of $64 million in the second quarter of 2017 included new client relationships with AIFC Exchange, a new stock exchange being established in Kazakhstan, and Deposito Central de Valores, the Chilean central securities depository. Additionally, Nasdaq announced SMARTS product extensions with the Investment Industry Regulatory Organization of Canada and the Monetary Authority of Singapore. In July 2017, Nasdaq also signed an agreement with SIX Swiss Exchange to implement a distributed ledger technology based solution for the OTC structured products business from SIX, highlighting further commercialization of blockchain with the Nasdaq Financial Framework.
- Nasdaq launches the Analytics Hub platform to help augment buy side trading strategies. The Nasdaq Analytics Hub platform provides the buy side with investment signals that are derived from structured and unstructured data sets, from both proprietary sources and collaboration with third-party partners. The May 2017 debut included four initial data sets. In July, Nasdaq introduced four additional data sets to broaden and deepen the high value content, providing insights from corporate filings, fundamental and technical factors. Nasdaq intends to add new data sets, sources and analytics over time.
- Nasdaq launches Auction on Demand in the Nordics to help customers fulfill their MiFID II transparency requirements. Nasdaq launched a new periodic auction feature in the Nordics called Auction on Demand that is designed to fulfill both MiFID I and MiFID II transparency rules and help market participants execute both large and small orders. Developed with professional investors in mind, Auction on Demand addresses a broad range of execution challenges for orders and runs in parallel to Nasdaq Nordic's lit order books.
- Nasdaq's Nordic exchanges achieved a record first half of the year for new listings, and The Nasdaq Stock Market led U.S. exchanges for IPOs in the first half of 2017. Nasdaq's Nordic exchanges welcomed a record 61 new listings and 6 First North to Main market upgrades in the first and second quarter of 2017, marking the strongest first half of the year in the history of the company in terms of listings activity. In the U.S. market, The Nasdaq Stock Market welcomed 64 new listings during the second quarter of 2017, 36 of which were IPOs including Okta, Appian, NCS Multistage and Carlyle Group's BDC. During the second quarter, The Nasdaq Stock Market won 52% of IPO listings, and 62% over the twelve months ended June 30, 2017.
- Nasdaq saw strong growth and record ETP assets under management tracking Nasdaq indexes. Overall assets under management (AUM) in ETPs benchmarked to Nasdaq's proprietary index families increased to a record $147 billion as of June 30, 2017, up 36% compared to June 30, 2016. The June 30, 2017 total AUM included $61 billion, or 41%, tracking smart beta indexes. Also as of June 30, 2017, the number of ETPs tracking Nasdaq-licensed indexes rose to 316, an increase of 18%, compared to June 30, 2016.
ABOUT NASDAQ
Nasdaq (Nasdaq:NDAQ) is a leading global provider of trading, clearing, exchange technology, listing, information and public company services. Through its diverse portfolio of solutions, Nasdaq enables customers to plan, optimize and execute their business vision with confidence, using proven technologies that provide transparency and insight for navigating today's global capital markets. As the creator of the world's second electronic stock market, its technology powers more than 90 marketplaces in 50 countries, and 1 in 10 of the world's securities transactions. Nasdaq is home to approximately 3,900 total listings with a market value of approximately $12 trillion. To learn more, visit: nasdaq.com/ambition or business.nasdaq.com.
NON-GAAP INFORMATION
In addition to disclosing results determined in accordance with U.S. GAAP, Nasdaq also discloses certain non-GAAP results of operations, including, but not limited to, net income attributable to Nasdaq, diluted earnings per share, operating income, and operating expenses, that include certain adjustments or exclude certain charges and gains that are described in the reconciliation table of U.S. GAAP to non-GAAP information provided at the end of this release. Management uses this non-GAAP information internally, along with U.S. GAAP information, in evaluating our performance and in making financial and operational decisions. We believe our presentation of these measures provides investors with greater transparency and supplemental data relating to our financial condition and results of operations. In addition, we believe the presentation of these measures is useful to investors for period-to-period comparisons of results as the items described below do not reflect ongoing operating performance.
These measures are not in accordance with, or an alternative to, U.S. GAAP, and may be different from non-GAAP measures used by other companies. Investors should not rely on any single financial measure when evaluating our business. We recommend investors review the U.S. GAAP financial measures included in this earnings release. When viewed in conjunction with our U.S. GAAP results and the accompanying reconciliations, we believe these non-GAAP measures provide greater transparency and a more complete understanding of factors affecting our business than U.S. GAAP measures alone.
We understand that analysts and investors regularly rely on non-GAAP financial measures, such as non-GAAP net income attributable to Nasdaq, non-GAAP diluted earnings per share, non-GAAP operating income and non-GAAP operating expenses to assess operating performance. We use these measures because they highlight trends more clearly in our business that may not otherwise be apparent when relying solely on U.S. GAAP financial measures, since these measures eliminate from our results specific financial items, such as those described below, that have less bearing on our ongoing operating performance.
Amortization expense of acquired intangible assets: We amortize intangible assets acquired in connection with various acquisitions. Intangible asset amortization expense can vary from period to period due to episodic acquisitions completed, rather than from our ongoing business operations. As such, if intangible asset amortization is included in performance measures, it is more difficult to assess the day-to-day operating performance of the businesses, the relative operating performance of the businesses between periods and the earnings power of Nasdaq. Management does not consider intangible asset amortization expense for the purpose of evaluating the performance of our business or its managers or when making decisions to allocate resources. Therefore, we believe performance measures excluding intangible asset amortization expense provide investors with a more useful representation of our businesses’ ongoing activity in each period.
Restructuring charges: Restructuring charges are associated with our 2015 restructuring plan to improve performance, cut costs and reduce spending and as of June 30, 2016 are primarily related to (i) severance and other termination benefits, (ii) asset impairment charges, and (iii) other charges. We exclude these restructuring costs because these costs do not reflect future operating expenses and do not contribute to a meaningful evaluation of Nasdaq’s ongoing operating performance or comparison of Nasdaq’s performance between periods.
Merger and strategic initiatives expense: We have pursued various strategic initiatives and completed a number of acquisitions in recent years which have resulted in expenses which would not have otherwise been incurred. These expenses generally include integration costs, as well as legal, due diligence and other third party transaction costs. The frequency and the amount of such expenses vary significantly based on the size, timing and complexity of the transaction. Accordingly, we exclude these costs for purposes of calculating non-GAAP measures which provide a more meaningful analysis of Nasdaq’s ongoing operating performance or comparisons in Nasdaq’s performance between periods.
Other significant items: We have excluded certain other charges or gains that are the result of other non-comparable events to measure operating performance. For the three months ended June 30, 2017, other significant items include loss on extinguishment of debt, wind down costs associated with an equity method investment which was previously written off, and the recognition of previously unrecognized tax benefits associated with positions taken in prior years. For the three months ended June 30, 2016, other significant items primarily include tax expense due to an unfavorable tax ruling received during the three months ended June 30, 2016, the impact of which related to prior periods, and the release of a sublease loss reserve due to the early exit of a facility. We believe the exclusion of such amounts allows management and investors to better understand the financial results of Nasdaq.
Foreign exchange impact: In countries with currencies other than the U.S. dollar, revenues and expenses are translated using monthly average exchange rates. Certain discussions in this release isolate the impact of year-over-year foreign currency fluctuations to better measure the comparability of operating results between periods. Operating results excluding the impact of foreign currency fluctuations are calculated by translating the current period’s results by the prior period’s exchange rates.
CAUTIONARY NOTE REGARDING FORWARD-LOOKING STATEMENTS
Information set forth in this communication contains forward-looking statements that involve a number of risks and uncertainties. Nasdaq cautions readers that any forward-looking information is not a guarantee of future performance and that actual results could differ materially from those contained in the forward-looking information. Such forward-looking statements include, but are not limited to (i) projections relating to our future financial results, total shareholder returns, growth, trading volumes, products and services, order backlog, taxes and achievement of synergy targets, (ii) statements about the closing or implementation dates and benefits of certain acquisitions and other strategic, restructuring, technology, de-leveraging and capital return initiatives, (iii) statements about our integrations of our recent acquisitions, (iv) statements relating to any litigation or regulatory or government investigation or action to which we are or could become a party, and (v) other statements that are not historical facts. Forward-looking statements involve a number of risks, uncertainties or other factors beyond Nasdaq’s control. These factors include, but are not limited to, Nasdaq’s ability to implement its strategic initiatives, economic, political and market conditions and fluctuations, government and industry regulation, interest rate risk, U.S. and global competition, and other factors detailed in Nasdaq’s filings with the U.S. Securities and Exchange Commission, including its annual reports on Form 10-K and quarterly reports on Form 10-Q which are available on Nasdaq’s investor relations website at http://ir.nasdaq.com and the SEC’s website at www.sec.gov. Nasdaq undertakes no obligation to publicly update any forward-looking statement, whether as a result of new information, future events or otherwise.
WEBSITE DISCLOSURE
Nasdaq intends to use its website, ir.nasdaq.com, as a means for disclosing material non-public information and for complying with SEC Regulation FD and other disclosure obligations. These disclosures will be included on Nasdaq’s website under “Investor Relations.”
NDAQF
MEDIA RELATIONS CONTACT:
Allan Schoenberg
+1.212.231.5534
allan.schoenberg@nasdaq.com

INVESTOR RELATIONS CONTACT:
Ed Ditmire, CFA
+1.212.401.8737
ed.ditmire@nasdaq.com
Disclosure: None.


