
Lots Of Volatility No Real Movement

- Volatility Kick
- Just Waiting For The Bond Bears
- Energy-less Oil
- Sector & Market Analysis
- 401k Plan Manager
Last week, I discussed the “Breakout Failure As Resistance Holds” stating: how, despite the carnage in Technology and Discretionary sectors, the overall market was mostly unaffected.
“The markets shot out of the gate on Monday and rose 20-points for the day which confirmed the breakout above previous resistance. Unfortunately, that bout of ‘exuberance’ was short-lived and the rally faded for the rest of week closing back below resistance as shown below.”
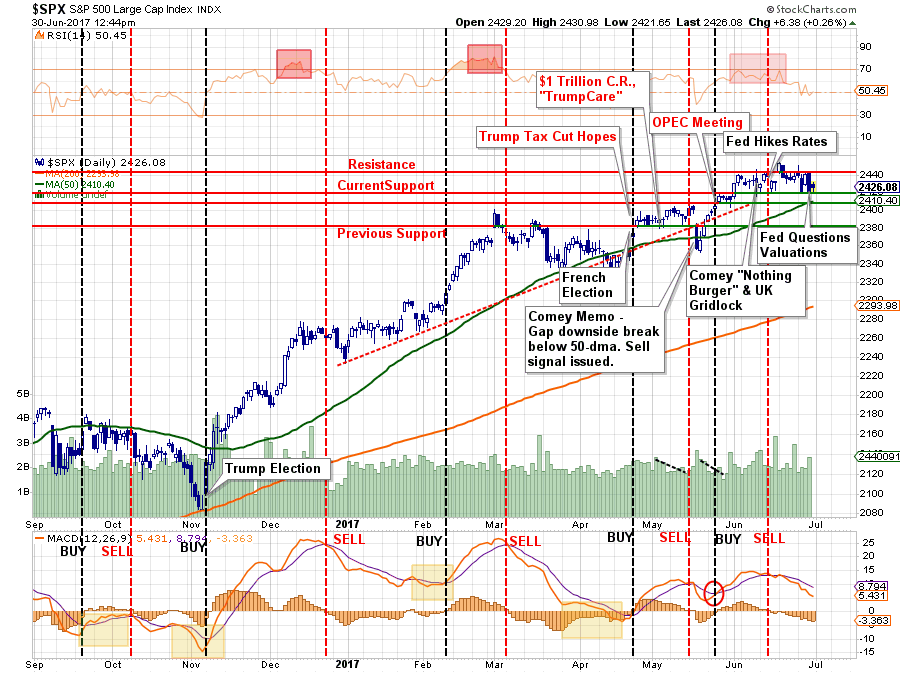
Importantly, note the short-term “sell signal” remains intact in the lower part of the chart which suggests pressure is currently to the downside. With only minor support currently in place, a break below 2410 could well suggest a decline to 2380 over the course of the next month.
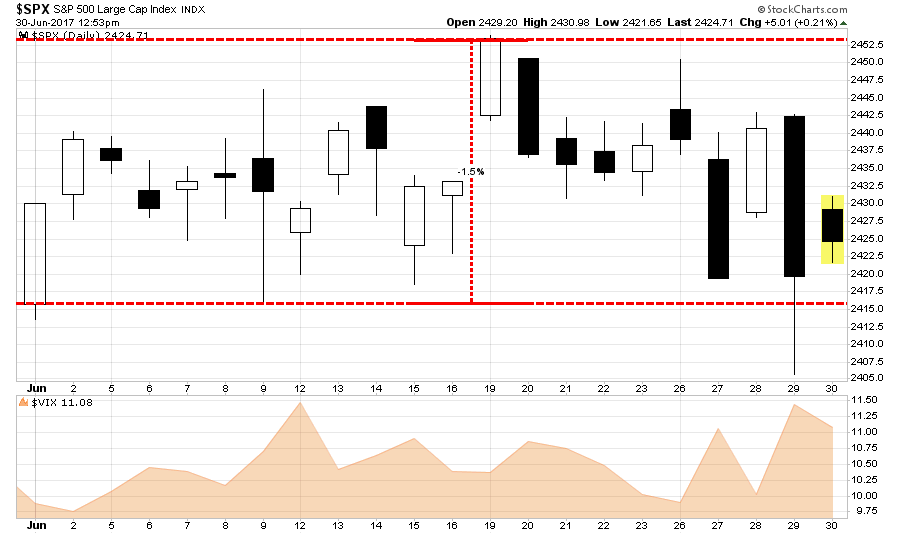
As noted on Friday, the last couple of weeks have experienced a sharp rise in price volatility. While stocks have vacillated in a very tight 1.5% trading range since the beginning of June, there has been little forward progress to speak of. However, notice that support at 2416 has remained solid as “robots” continue to execute their program of “buying the dips.”
This lack of progress once again has us “stuck” with respect to portfolio positioning. As I noted two week’s ago in this missive:
“During last week’s pullback, we added modestly to our broader-based ‘core’ holdings for the second time over the last couple of months. to participate with the breakout. Stops have been moved up and remain very tight.
While I remain very cautious on the overall market, the trend remains bullishly biased which keeps portfolios allocated on the long side for the time being. However, I will not be surprised by a reversal and failure of the breakout leading to us getting stopped out of positions.”
Unfortunately, we haven’t changed much over the last few weeks with the exception of taking profits and rebalancing technology, health care and international exposure back to market weights last week. (This was noted in the sector recommendations chart in the Sector Analysis section.)
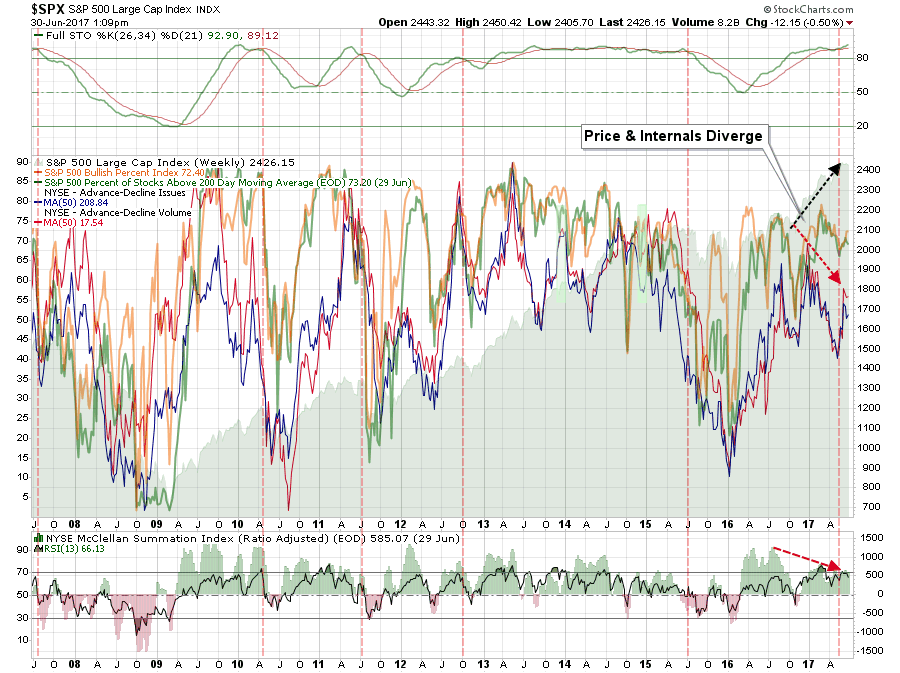
Internals also weakened again after only a mild improvement which also keeps our 'guard' elevated.
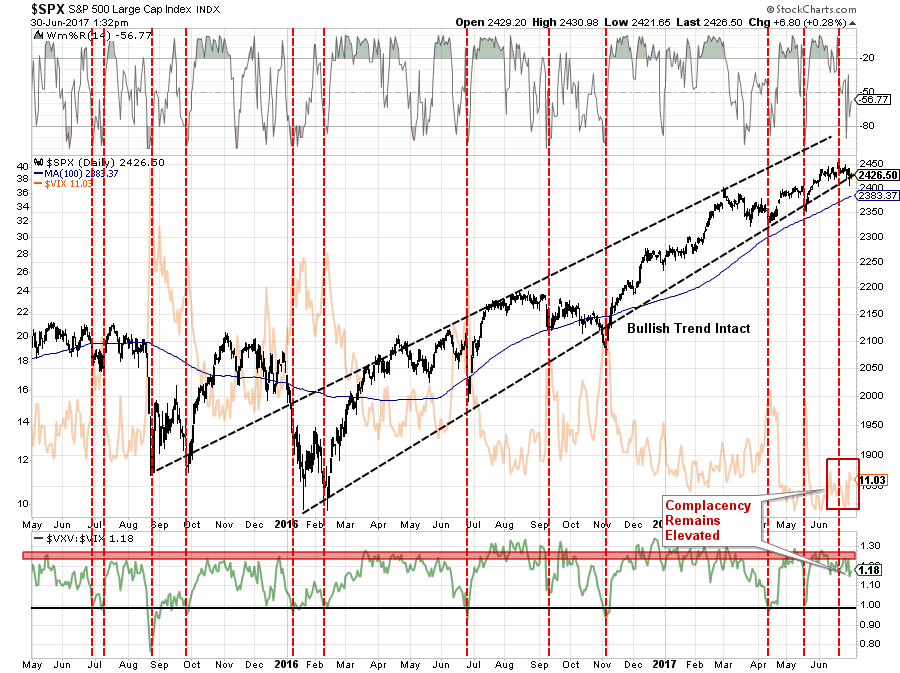
Despite the uptick in volatility last week, volatility remains suppressed at historically low levels. As shown in the chart below, the recent “back and forth” action has reduced the overbought condition of the market short-term with stocks testing the bullish uptrend. However, complacency remains elevated which suggests the risk of a break of support could lead to a sharper, and rather sudden, decline.
I continue to suggest a healthy regimen of risk management practices in portfolios by following some rather simple guidelines (the same ones that we followed to harvest profits recently as noted above.)
- Tighten up stop-loss levels to current support levels for each position.
- Hedge portfolios against major market declines.
- Take profits in positions that have been big winners
- Sell laggards and losers
- Raise cash and rebalance portfolios to target weightings.
For now, we wait and let the markets tell us what it wants to do next.
Beware the “Dog days of summer.”
Just Waiting For Bond Bears To Re-Emerge
3…2…1…During the last week, we finally got a bounce in interest rates from very oversold levels (remember rates are inverse to bond prices so oversold rates = overbought bond prices.) I am patiently awaiting the “bond bears” to come out in force once again declaring the “bond bull market” dead and telling you why you should sell your bonds and buy overvalued stocks.
This has been the case since mid-2013 and all along the way, through numerous missives, I have explained why such an outcome will not be the case. To wit:
“As I have discussed many times in the past, interest rates are a function of three primary factors: economic growth, wage growth, and inflation. The relationship can be clearly seen in the chart below.”

“Okay…maybe not so clearly. Let me clean this up by combining inflation, wages, and economic growth into a single composite for comparison purposes to the level of the 10-year Treasury rate.”
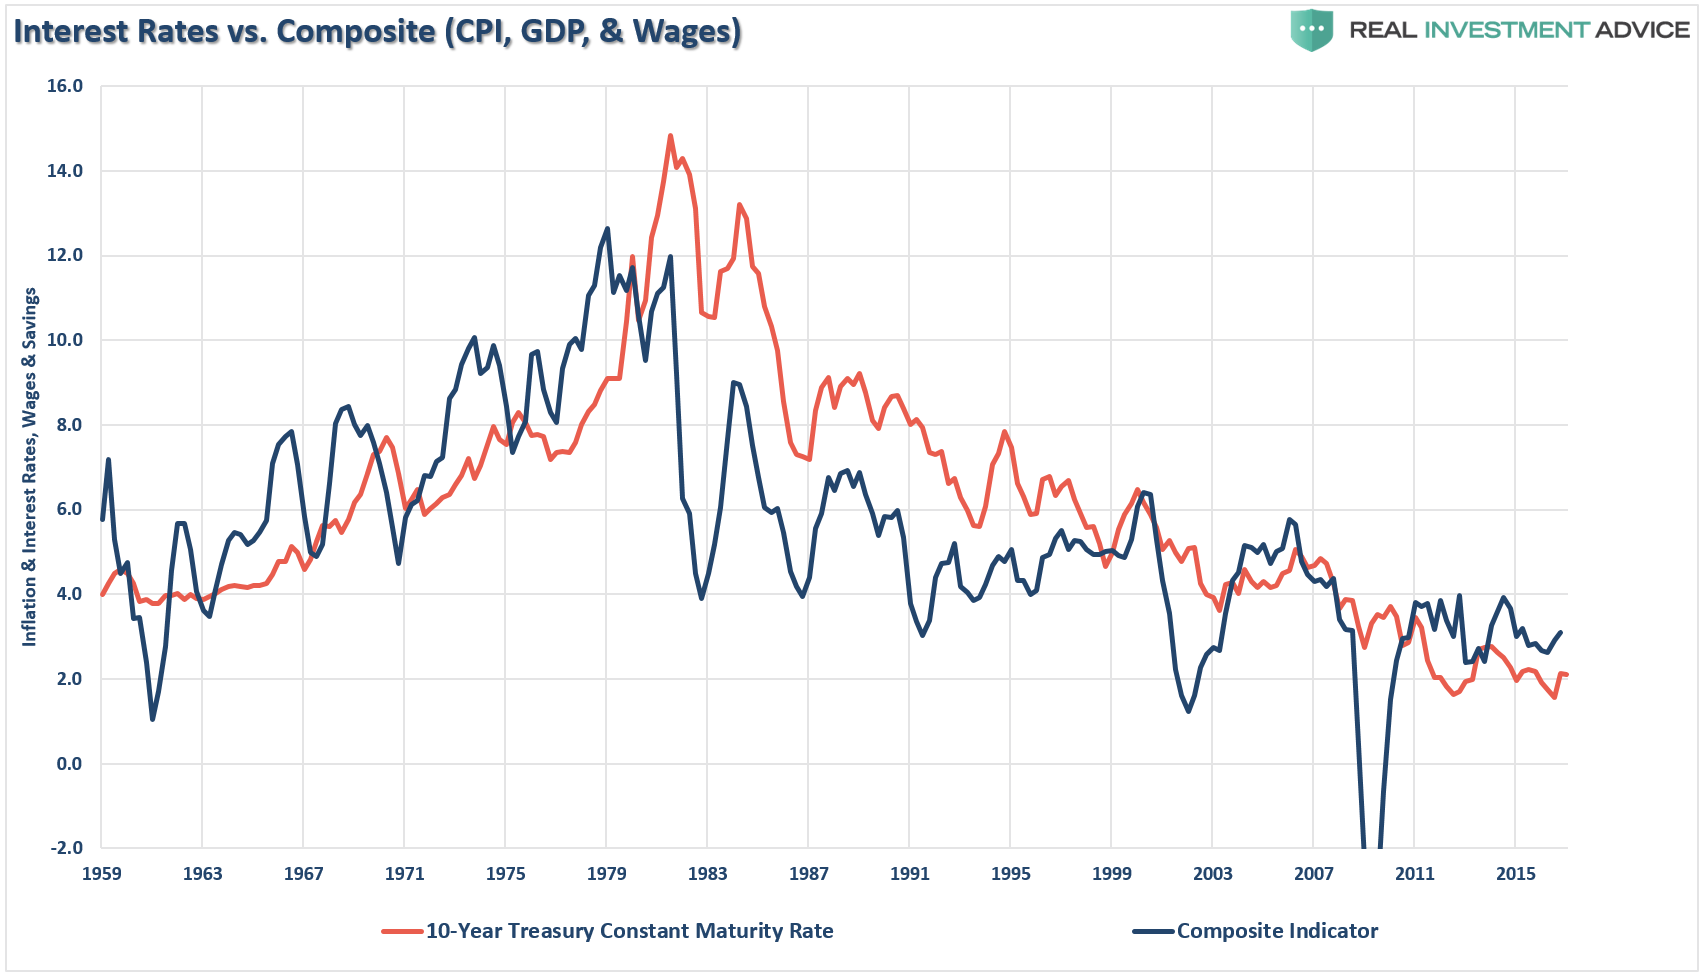
“As you can see, the level of interest rates is directly tied to the strength of economic growth and inflation. Since wage growth is what allows individuals to consume, which makes up roughly 70% of economic growth, the level of demand for borrowing is directly tied to the demand from consumption. As demand increases, businesses then demand credit for increases in capital expenditures or production. The interest rates of loans are driven by demand from borrowers.
Since ‘borrowing costs’ are directly tied to the underlying economic factors that drive the NEED for credit, interest rates, and therefore bond values, can not be overvalued. Furthermore, since bonds have a finite value at maturity, there is little ability for an overvaluation in the ‘price paid’ for a bond as compared to its future ‘finite value’ at maturity.”
The last sentence is the most important. There is a point to where bond prices lead to a negative rate of return. At that point, a bond buyer will only buy bonds with the expectation rates will become even more negative. In such an environment, really BAD things are likely progressing economically.
That is an analysis for another day. For now, we are looking for an opportunity to increase our exposure to bonds opportunistically.
As I addressed in last week’s sector analysis:
“As expected a couple of months ago, rates fell as the economic underpinnings failed to come to fruition. However, with rates now extremely oversold (inverse of bond prices) bonds are now extremely overbought. Look for a pullback to support on the index to $125 to add bond holdings back into portfolios. There is no reasonable stop currently for bond trading positions so caution is advised.”
The chart below is updated from last week:

As shown, that call was timely, and bonds pulled back to the first Fibonacci retracement level of $125. However, bonds are not yet oversold. Therefore, we will hold off on adding to existing bond exposures, or adding new positions, this week with the expectation rates could rise a bit further. The chart below is the 10-year interest rate. The current target for this reflexive rally is 2.3% in the current downtrend as rates head back towards 1.9%.
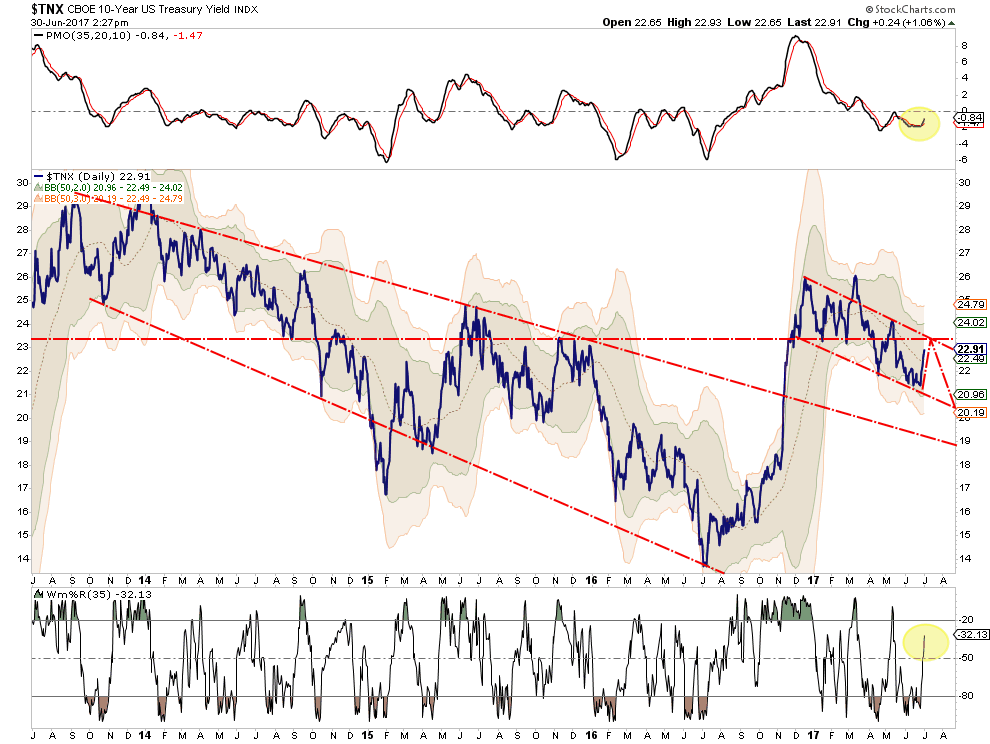
From a technical basis the trend lower from the recent peak at 2.6%, the spike was driven by China selling bonds in an attempt to stabilize their currency, remains firmly intact. When the economy slips into the next recession, interest rates will once again join the long-term downtrend towards 1% or less.
So, as I stated, we are looking to BUY bonds…but at the right level.
Energy-Less Oil
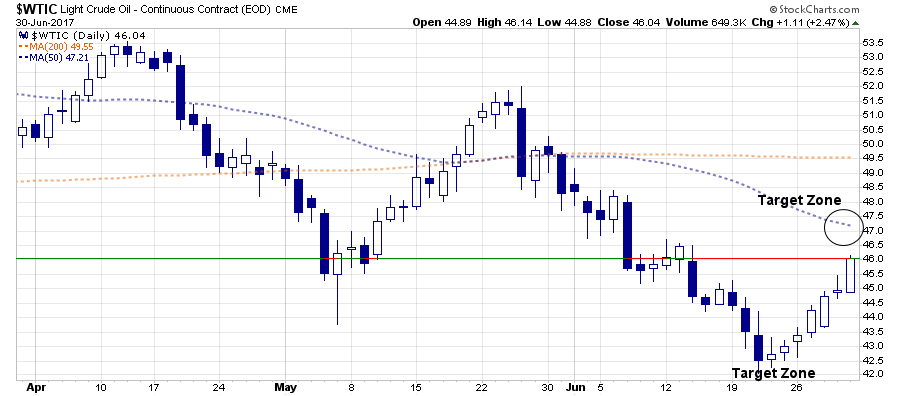
I have been discussing over the last couple of weeks, that oil prices had broken important supports at $48, then $45, and hit our target of the low $40’s. With oil prices extremely oversold, it is not surprising to see a bounce this past week as shown in the chart below:
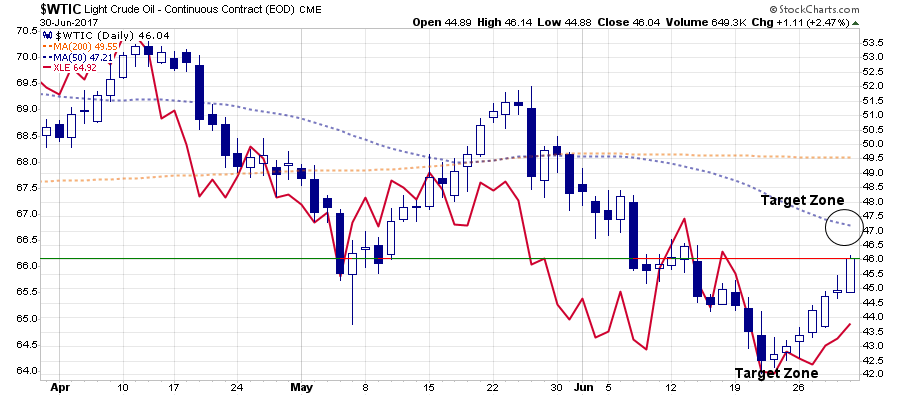
However, despite the sharp rally in oil prices of 8%ish, energy stocks (XLE) failed to gain much traction by rising roughly 2% from recent lows.
As I noted in last week’s sector breakdown:
“The OPEC oil cut has likely run the majority of its course and with Permian Basin production on the rise, the pressure on oil prices from supply/demand imbalances remains an issue. I discussed the headwinds to oil prices in May of this year as oil prices approached $50/bbl.
While investors have chased energy stocks on expectations of minor production cuts from OPEC, little has been done to resolve the fundamental valuation problems which face a majority of these companies, and investors have paid the price as of late. Which is why I had suggested selling energy stocks in November of last year as noted below.”
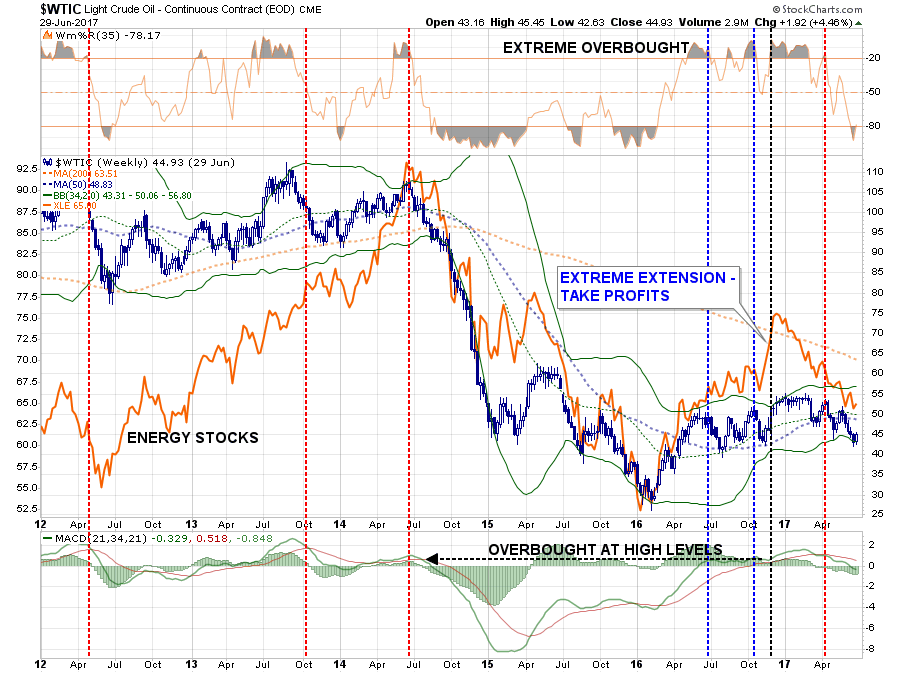
“Importantly, note the weekly ‘sell signal’ (vertical dashed red line) at very high levels currently for oil. While there is hope the production cuts will lift oil prices in the short-term, the longer-term technical backdrop suggests a bigger correction may already be in the works.”
Over the last few months, I have repeatedly suggested allocation models that energy exposure should be severely reduced or eliminated entirely. That has been profitable advice since then.
However, as I did note last week:
“The energy sector remains in a negative trend but has now reached extremely oversold levels along with oil prices. Any rally in oil prices that fails to climb above $48/bbl should be ‘faded’ and energy exposure reduced to extreme underweight in portfolios for the time being. There will come a time for owning energy-related equities, it just isn’t right now.”
Outside of a short-term trading opportunity, that advice remains salient this week for longer-term investors.
Market & Sector Analysis
Data Analysis Of The Market & Sectors For Traders
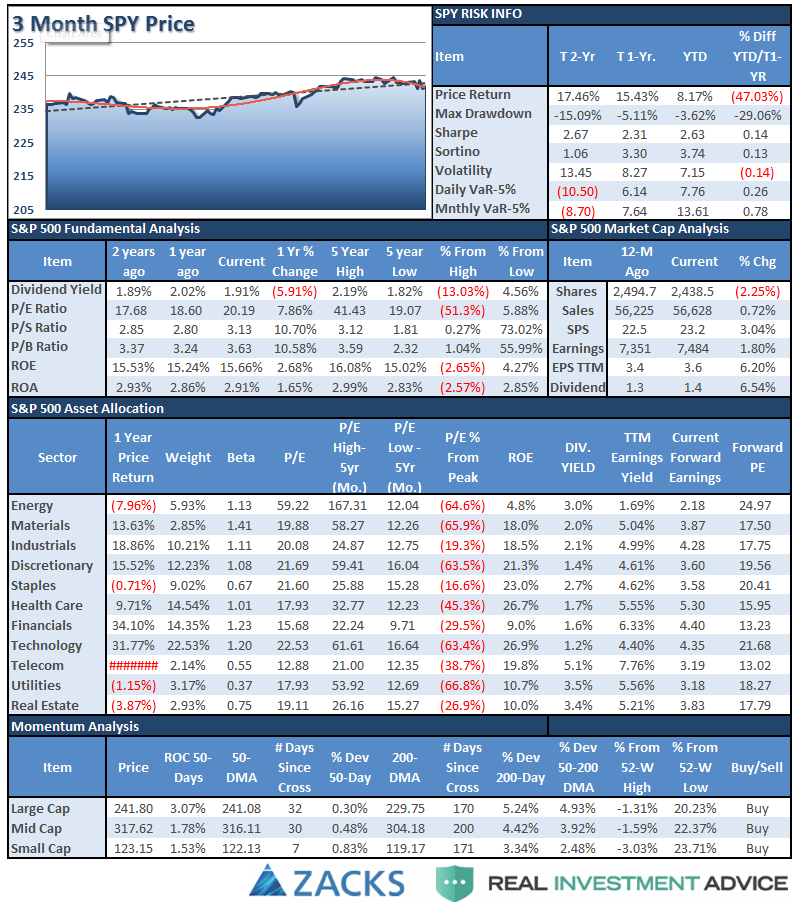
S&P 500 Tear Sheet
The “Tear Sheet” below is a “reference sheet” provide some historical context to markets, sectors, etc. and looking for deviations from historical extremes.
If you have any suggestions or additions you would like to see, send me an email.
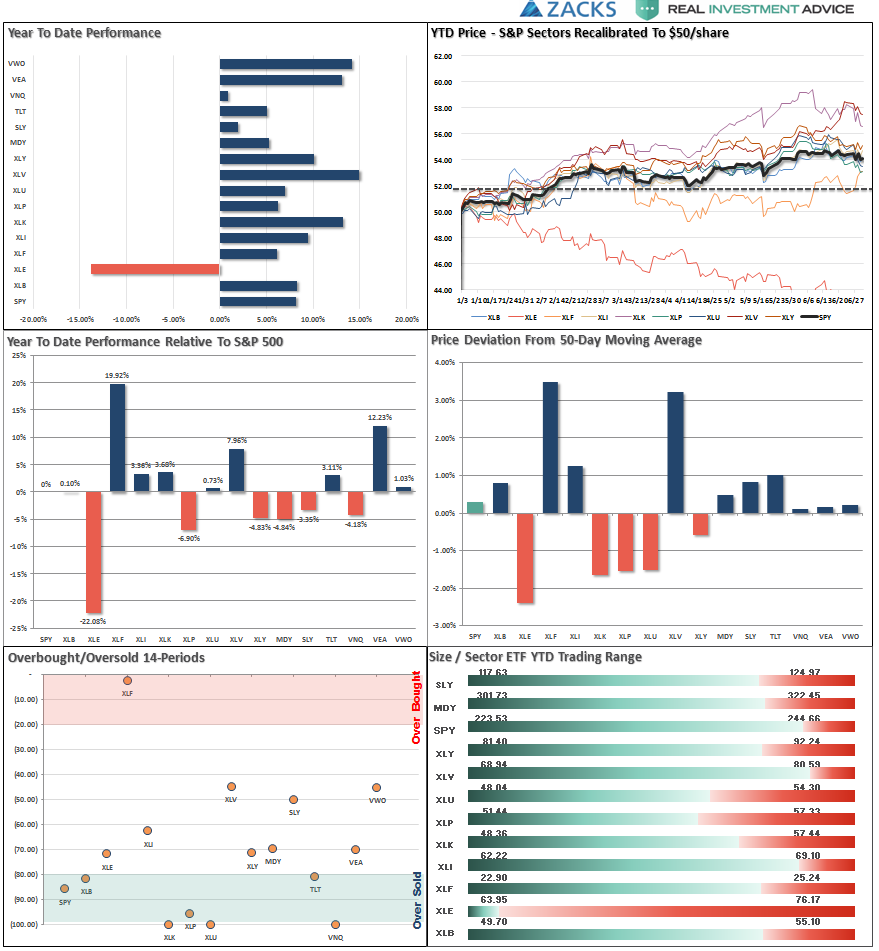
Performance Analysis
New! Thank you for all the comments on the performance analysis below. Due to many of the emails I got, I have swapped out the sector weight graph for a year-to-date performance range analysis. Keep the comments coming. (Email Me)
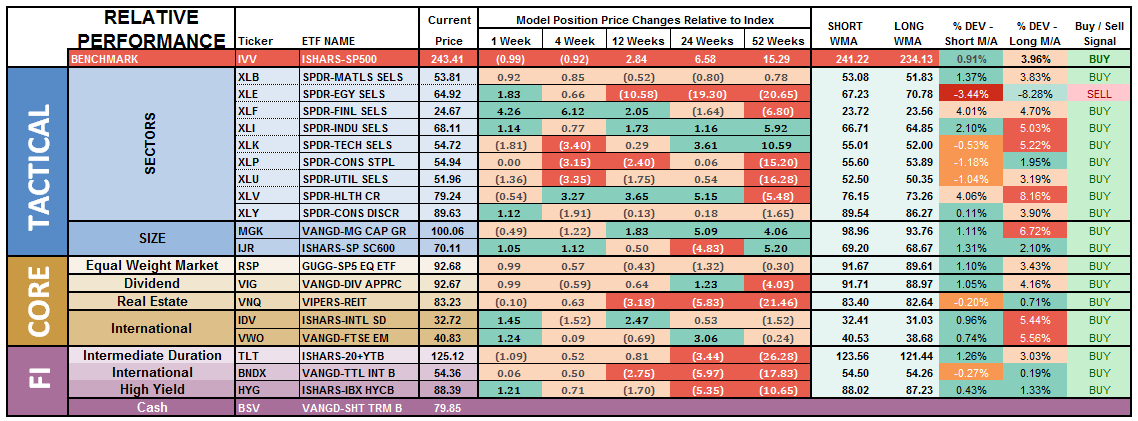
ETF Model Relative Performance Analysis
Sector Analysis
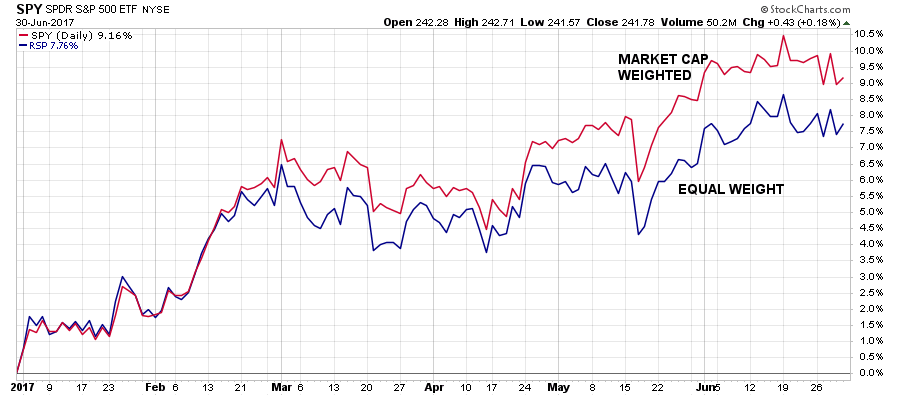
Taking a look at the individual sectors of the S&P 500, we see a bit more deterioration than what the market currently reflects. This is due to the heavy weightings of certain sectors of the market which can skew the index somewhat versus what is happening internally. This can be more clearly seen by looking at a chart which compares an EQUAL weight to a market-capitalization weighted S&P 500 index:
Let’s look at the damage occurring internally at the moment.
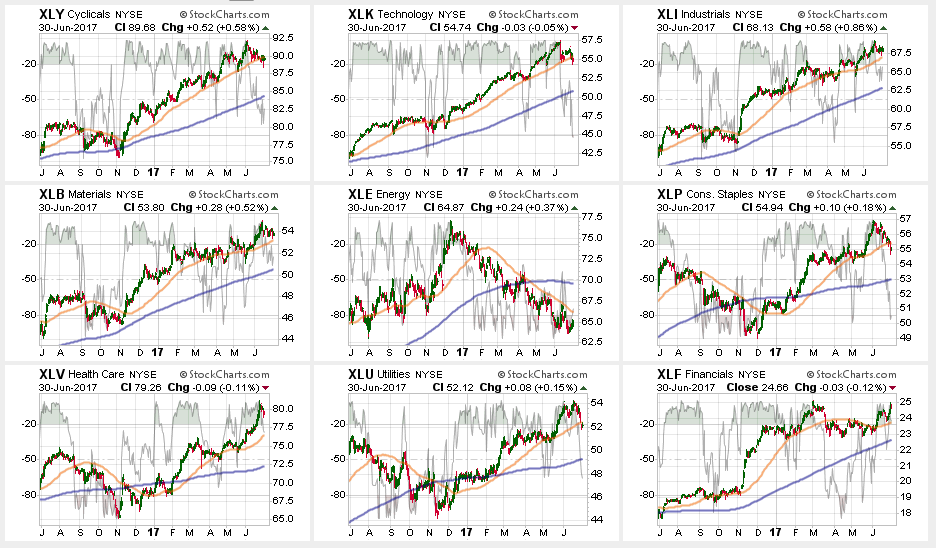
Technology, Discretionary, Utilities, and Staples continued their recent weakness, with all sectors having now BROKEN their respective 50-dma’s. The correction does set up a potential trading opportunity provided support holds, but the break below the 50-dma raising a warning flag. If current supports in these sectors give way, we will recommend reducing overall portfolio weightings.
Financials, Health Care, Materials, and Industrials again maintained their lead as money flows rotated primarily in Financials out of Tech and Discretionary. All of these sectors remain overbought so some profit-taking and rebalancing is advised.
Energy – Oil prices rallied last week, finally, as noted in the main missive above. The supply of oil remains a problem with rig counts rising and economic weakness prevalent. With a major sector sell signal, and the cross of the 50-dma below the 200-dma, we remain out of the space for the time being. Use any rally to reduce exposure accordingly until the technical trends improve.
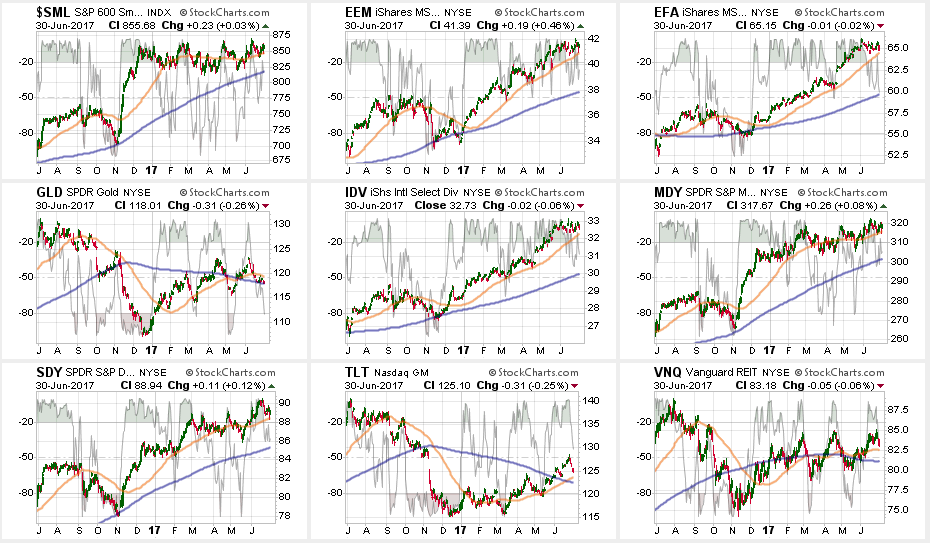
Small and Mid-Cap stocks regained their respective 50-dma’s which removes their warning signs but remained weak relative to the broader market. This keeps concern elevated at the moment, however, maintain exposure for now, but do so cautiously with stops at support.
Emerging Markets and International Stocks as noted previously:
“There is a good bit of risk built into international stocks currently. We took profits a few weeks ago, but the recent extension suggests another round of rebalancing is likely wise. Take profits and rebalance sector weights but continue to hold these sectors but stop levels should be moved up to the 50-dma.”
A pull back to support will provide an opportunity to rebalance holdings in the short-term. The consolidation in industrialized internal markets is bullish and a potential point to add exposure may be approaching. We will update next week if such becomes the case.
Gold – The failure of the precious metal at critical resistance of 1300/oz keeping us out of our long-term positions currently. The short-term trading positions were also stopped out on the drop below $1260/oz for now. With Gold back below the 50-dma, caution remains advised with hard stops set on a break below $1240/oz or the 200-dma.
S&P Dividend Stocks, along with other more interest rate sensitive sectors, are being sold on the technical bounce in interest rates this past week. We have recommended previously taking profits in these sectors which now provides an opportunity to add exposure at a lower cost as this opportunity develops. Continue to hold current positions but maintain stops at the recent lows.
Bonds and REIT’s were hit with the profit taking we recommended last week. With the 50-dma’s moving upward, these sectors are attractive but extremely overbought. Wait for a pullback to add to exposures.
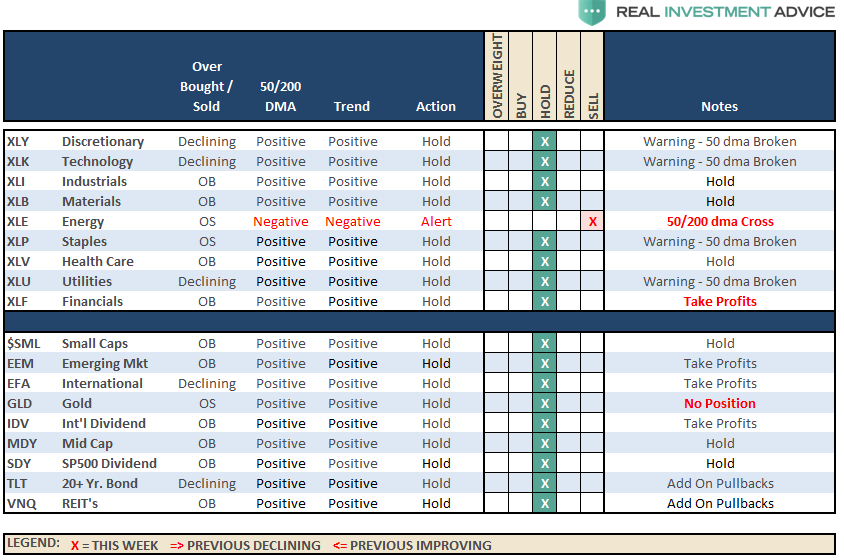
The table below shows thoughts on specific actions related to the current market environment.
(These are not recommendations or solicitations to take any action. This is for informational purposes only related to market extremes and contrarian positioning within portfolios. Use at your own risk and peril.)
Portfolio Update:
The bullish trend remains positive, which keeps us allocated on the long side of the market for now. However, more and more “red flags” are rising which suggests a bigger correction may be in the works over the next couple of months.
Two weeks ago, during the correction, we added modestly to our core holdings for the second time this year. However, we are still maintaining slightly higher levels of cash currently.
We are currently holding positions in portfolios with near full exposure. We did rebalance positions last week, like Health Care and Technology, which had large run-ups and were grossly extended.
As I stated last week:
“While I am not excited about the overall risk/return makeup of the market currently, as a portfolio manager it is the discipline and strategy that drives action. Everything else is secondary.”
THE REAL 401k PLAN MANAGER
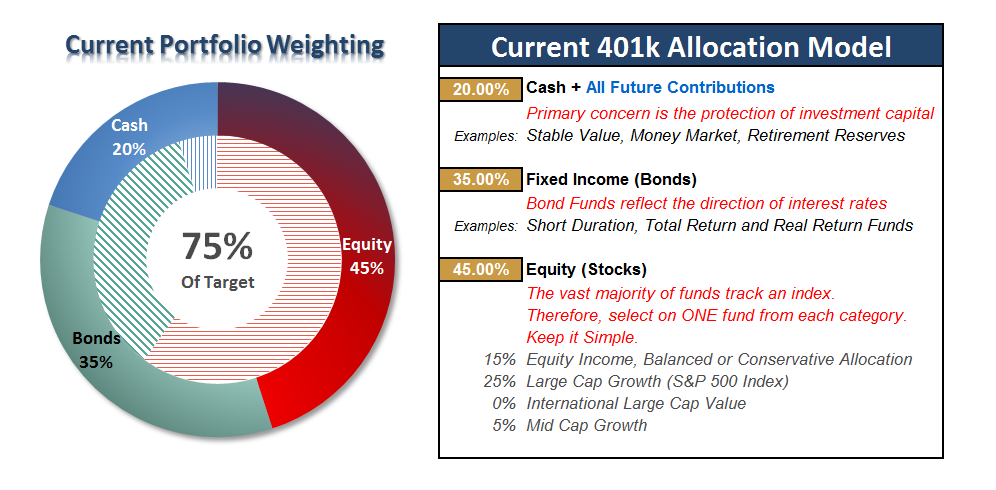
The Real 401k Plan Manager – A Conservative Strategy For Long-Term Investors

There are 4-steps to allocation changes based on 25% reduction increments. As noted in the chart above a 100% allocation level is equal to 60% stocks. I never advocate being 100% out of the market as it is far too difficult to reverse course when the market changes from a negative to a positive trend. Emotions keep us from taking the correct action.

No Change From Last Week
After a week of lot’s of “up and down,” the markets ended just about where they started. The lack of forward motion keeps models on hold this week as internal deterioration resumed. That turmoil kept the initial warning signal and “sell” signal intact which keeps portfolios a little more heavily weighted in cash.
As opposed to our portfolio model allocations, where we have more flexibility in movement, we look for opportunities to adjust risk exposure with a view of a 90-day holding period. (This is due to 401k trading restrictions. If we cannot get comfortable with a 90-day outlook, we will remain on hold.)
After weeks of refraining from adding further fixed income holdings, and taking profits, the pop in interest rates will provide an entry point potentially in the next week or so. Stay tuned.
If you need help after reading the alert; don’t hesitate to contact me.
Current 401-k Allocation Model
The 401k plan allocation plan below follows the K.I.S.S. principal. By keeping the allocation extremely simplified it allows for better control of the allocation and a closer tracking to the benchmark objective over time. (If you want to make it more complicated you can, however, statistics show that simply adding more funds does not increase performance to any great degree.)
401k Choice Matching List
The list below shows sample 401k plan funds for each major category. In reality, the majority of funds all track their indices fairly closely. Therefore, if you don’t see your exact fund listed, look for a fund that is similar in nature.

Disclosure: The information contained in this article should not be construed as financial or investment advice on any subject matter. Streettalk Advisors, LLC expressly disclaims all liability in ...
more


Thanks for sharing