
Johnson & Johnson Valuation – January 2017
Benjamin Graham taught that Intelligent Investors must do a thorough fundamental analysis of investment opportunities to determine their intrinsic value and inherent risk. This is best done by utilizing a systematic approach to analysis that will provide investors with a sense of how a specific company compares to another company or by reviewing the 10 Stocks for Using A Benjamin Graham Value Investing Strategy – January 2017.By using the ModernGraham method one can review a company’s historical accomplishments and determine an intrinsic value that can be compared across industries. What follows is a stock analysis showing a specific look at how Johnson & Johnson (JNJ) fares in the ModernGraham valuation model.
Company Profile (obtained from Google Finance): Johnson & Johnson is a holding company, which is engaged in the research and development, manufacture and sale of a range of products in the healthcare field. The Company’s segments include Consumer, Pharmaceutical and Medical Devices. The Consumer segment includes a range of products used in the baby care, oral care, skin care, over-the-counter pharmaceutical, women’s health and wound care markets. The Pharmaceutical segment is focused on over five therapeutic areas, including immunology, infectious diseases, neuroscience, oncology, and cardiovascular and metabolic diseases. The Medical Devices segment includes a range of products used in the orthopedic, surgery, cardiovascular, diabetes care and vision care fields. Its research facilities are located in the United States, Belgium, Brazil, Canada, China, France, Germany, India, Israel, Japan, the Netherlands, Singapore, Switzerland and the United Kingdom.
(Click on image to enlarge)

Stage 1: Is this company suitable for the Defensive Investor or the Enterprising Investor?
What kind of Intelligent Investor are you?
| Defensive Investor; must pass 6 out of the following 7 tests. | ||||
| 1. Adequate Size of the Enterprise | Market Cap > $2Bil | $311,718,494,701 | Pass | |
| 2. Sufficiently Strong Financial Condition | Current Ratio > 2 | 2.73 | Pass | |
| 3. Earnings Stability | Positive EPS for 10 years prior | Pass | ||
| 4. Dividend Record | Dividend Payments for 10 years prior | Pass | ||
| 5. Earnings Growth | Increase of 33% in EPS in past 10 years using 3 year averages at beginning and end | 36.67% | Pass | |
| 6. Moderate PEmg Ratio | PEmg < 20 | 20.79 | Fail | |
| 7. Moderate Price to Assets | PB Ratio < 2.5 OR PB*PEmg < 50 | 4.39 | Fail | |
| Enterprising Investor; must pass 4 out of the following 5 tests, or be suitable for the Defensive Investor. | ||||
| 1. Sufficiently Strong Financial Condition | Current Ratio > 1.5 | 2.73 | Pass | |
| 2. Sufficiently Strong Financial Condition | Debt to NCA < 1.1 | 0.59 | Pass | |
| 3. Earnings Stability | Positive EPS for 5 years prior | Pass | ||
| 4. Dividend Record | Currently Pays Dividend | Pass | ||
| 5. Earnings Growth | EPSmg greater than 5 years ago | Pass | ||
Stage 2: Determination of Intrinsic Value
(Click on image to enlarge)
| EPSmg | $5.51 |
| MG Growth Estimate | 5.35% |
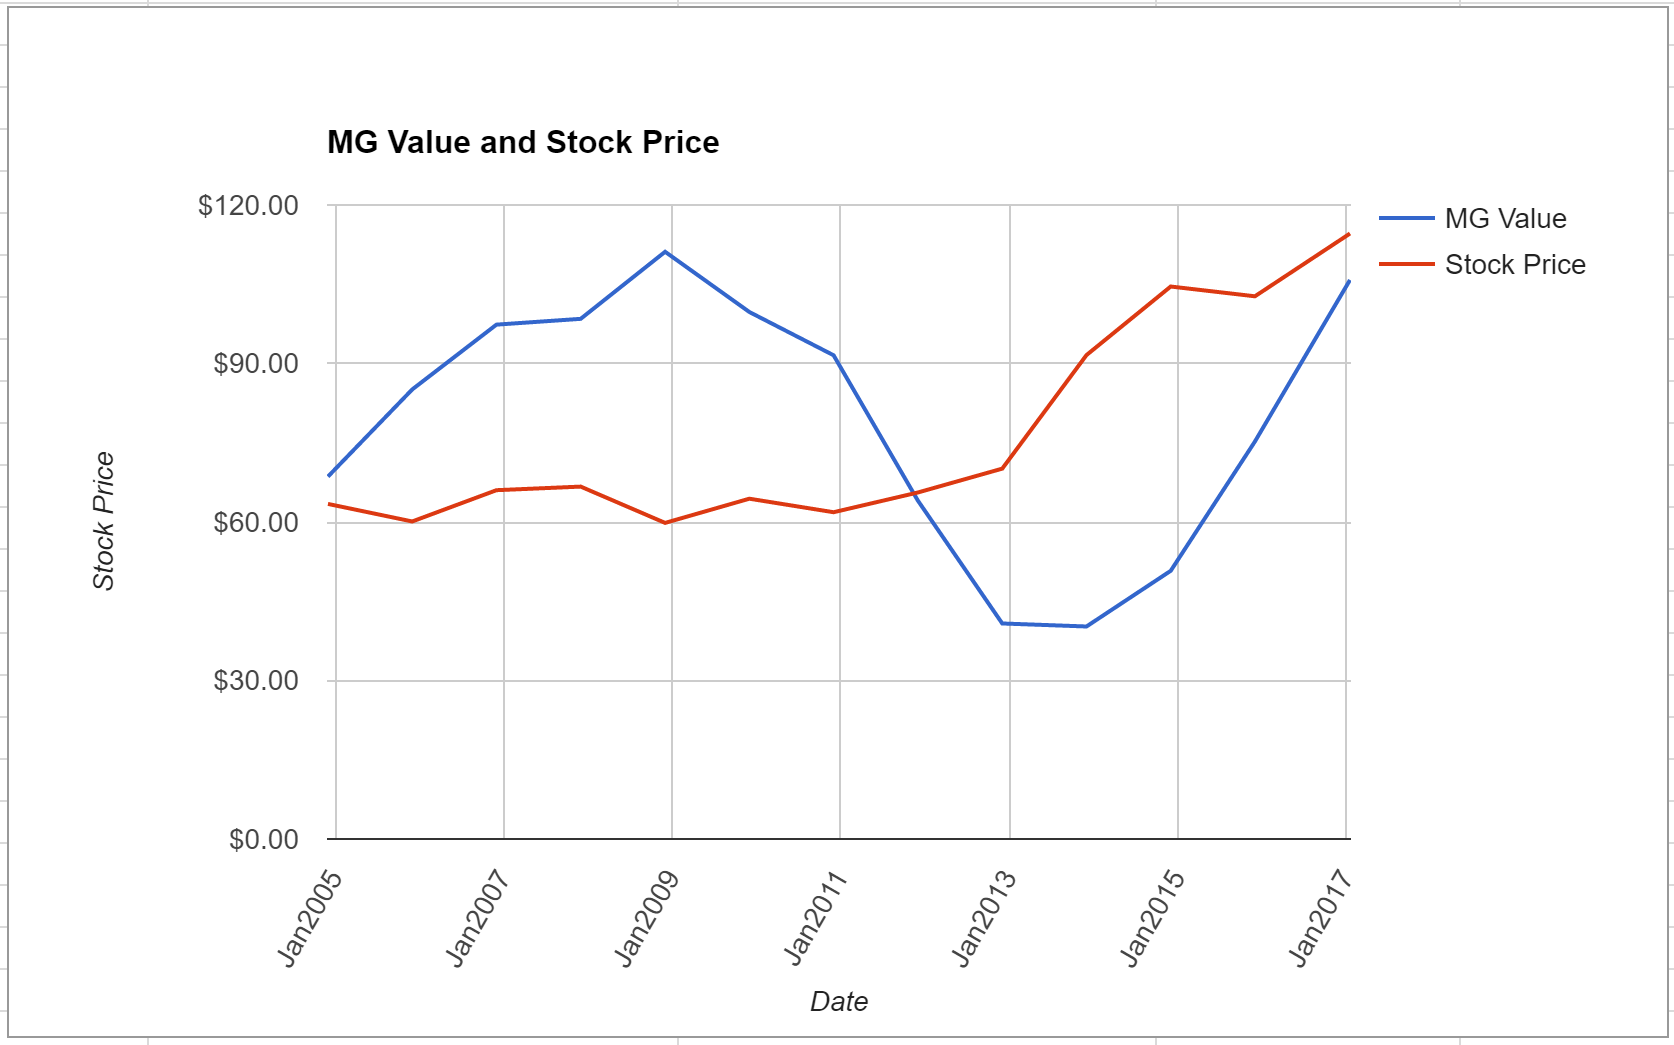
| MG Value | $105.81 |
| Opinion | Fairly Valued |
| MG Grade | B+ |
| MG Value based on 3% Growth | $79.94 |
| MG Value based on 0% Growth | $46.86 |
| Market Implied Growth Rate | 6.14% |
| Current Price | $114.60 |
| % of Intrinsic Value | 108.30% |
Johnson & Johnson is suitable for the Enterprising Investor but not the more conservative Defensive Investor. The Defensive Investor is concerned with the high PEmg and PB ratios. The Enterprising Investor has no initial concerns. As a result, all Enterprising Investors following the ModernGraham approach should feel comfortable proceeding with the analysis.
As for a valuation, the company appears to be Fairly Valued after growing its EPSmg (normalized earnings) from $4.06 in 2012 to an estimated $5.51 for 2016. This level of demonstrated earnings growth supports the market’s implied estimate of 6.14% annual earnings growth over the next 7-10 years. As a result, the ModernGraham valuation model, based on the Benjamin Graham value investing formula, returns an estimate of intrinsic value within a margin of safety relative to the price.
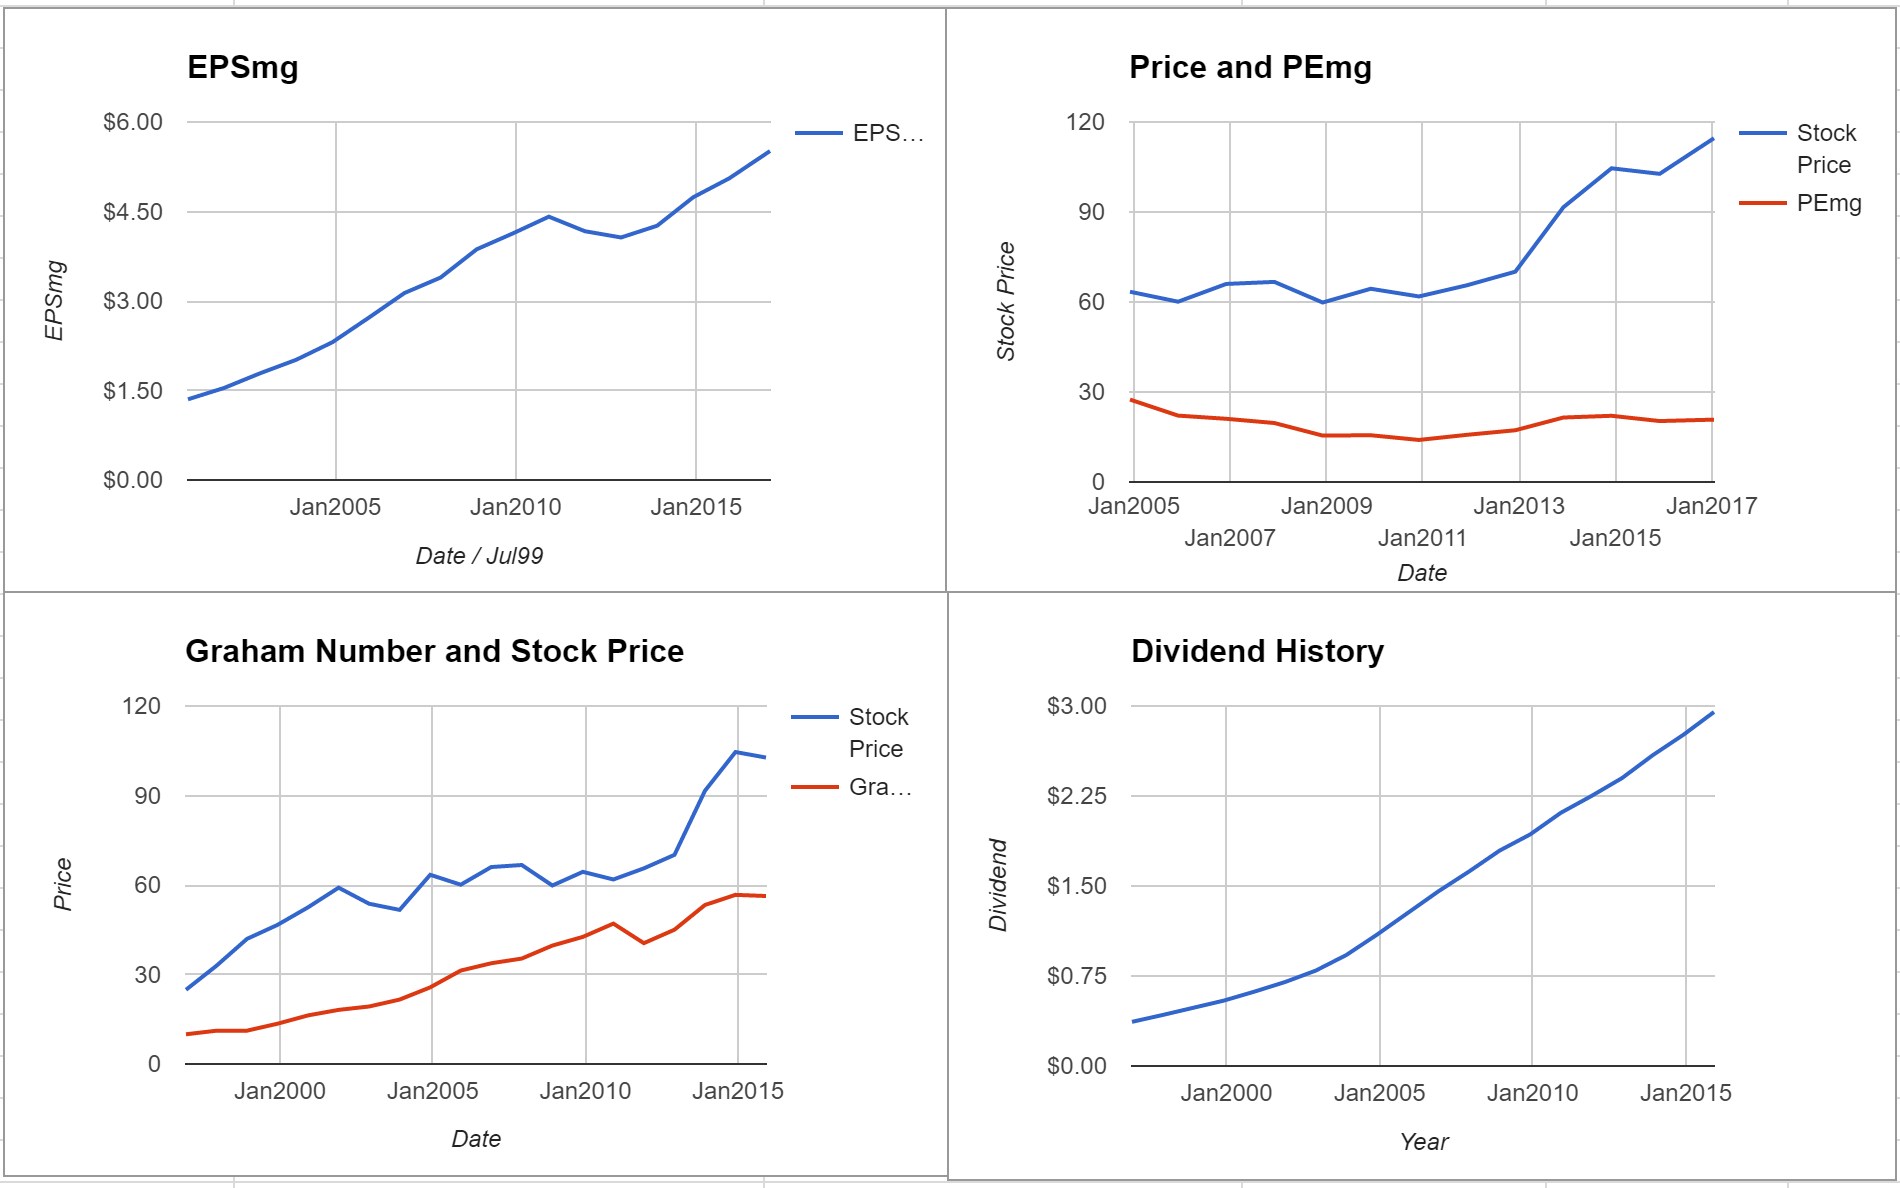
At the time of valuation, further research into Johnson & Johnson revealed the company was trading above its Graham Number of $60.27. The company pays a dividend of $3.1 per share, for a yield of 2.7%, putting it among the best dividend paying stocks today. Its PEmg (price over earnings per share – ModernGraham) was 20.79, which was below the industry average of 28.95, which by some methods of valuation makes it one of the most undervalued stocks in its industry. Finally, the company was trading above its Net Current Asset Value (NCAV) of $-1.54.
Johnson & Johnson performs fairly well in the ModernGraham grading system, scoring a B+.
Stage 3: Information for Further Research
(Click on image to enlarge)
| Net Current Asset Value (NCAV) | -$1.54 |
| Graham Number | $60.27 |
| PEmg | 20.79 |
| Current Ratio | 2.73 |
| PB Ratio | 4.39 |
| Current Dividend | $3.10 |
| Dividend Yield | 2.71% |
| Number of Consecutive Years of Dividend Growth | 20 |
Useful Links:
| ModernGraham tagged articles | Morningstar |
| Google Finance | MSN Money |
| Yahoo Finance | Seeking Alpha |
| GuruFocus | SEC Filings |
Most Recent Balance Sheet Figures
| Balance Sheet Information | 9/1/2016 |
| Total Current Assets | $63,319,000,000 |
| Total Current Liabilities | $23,230,000,000 |
| Long-Term Debt | $23,546,000,000 |
| Total Assets | $140,369,000,000 |
| Intangible Assets | $50,813,000,000 |
| Total Liabilities | $67,600,000,000 |
| Shares Outstanding (Diluted Average) | 2,785,400,000 |
Earnings Per Share History
| EPS History | |
| Next Fiscal Year Estimate | $6.04 |
| Dec2015 | $5.48 |
| Dec2014 | $5.70 |
| Dec2013 | $4.81 |
| Dec2012 | $3.86 |
| Dec2011 | $3.49 |
| Dec2010 | $4.78 |
| Dec2009 | $4.40 |
| Dec2008 | $4.57 |
| Dec2007 | $3.63 |
| Dec2006 | $3.73 |
| Dec2005 | $3.35 |
| Dec2004 | $2.74 |
| Dec2003 | $2.29 |
| Dec2002 | $2.16 |
| Dec2001 | $1.84 |
| Dec2000 | $1.61 |
| Dec1999 | $1.39 |
| Dec1998 | $1.06 |
| Dec1997 | $1.21 |
| Dec1996 | $1.09 |
Earnings Per Share – ModernGraham History
| EPSmg History | |
| Next Fiscal Year Estimate | $5.51 |
| Dec2015 | $5.06 |
| Dec2014 | $4.74 |
| Dec2013 | $4.26 |
| Dec2012 | $4.06 |
| Dec2011 | $4.17 |
| Dec2010 | $4.41 |
| Dec2009 | $4.13 |
| Dec2008 | $3.87 |
| Dec2007 | $3.39 |
| Dec2006 | $3.13 |
| Dec2005 | $2.72 |
| Dec2004 | $2.31 |
| Dec2003 | $2.01 |
| Dec2002 | $1.79 |
| Dec2001 | $1.54 |
| Dec2000 | $1.35 |
Recommended Reading:
Other ModernGraham posts about the company
Other ModernGraham posts about related companies
Disclaimer:The author held a long position in Starwood Property Trust (STWD) and Western Refining Inc (WNR) but did not hold a position in any other company mentioned in this article at the ...
more

