
In The Coming Correction Here Are Five “Flight To Quality Stocks” To Own That Have A Large Margin Of Safety
In my work as an Equity Analyst I am currently having great difficulty finding stocks to invest in that provide me with an adequate margin of safety. This usually is a sign that the markets are overvalued and could be heading for a correction. Besides being an Equity Analyst, I am also a Portfolio Manager for Conservative Equity Investment Advisors, a registered investment advisory firm, where most of my clients are retirees. That being the case, I try to be conservative and demand an adequate margin of safety when picking stocks for them. The system I employ to determine this margin of safety are based on the following three methods used to calculate free cash flow:
Standard Free Cash Flow Per Share
(Cash Flow from Operations - Capital Spending)/Diluted Shares Outstanding
Levered Free Cash Flow Per Share
(Formula: (EBIT + Interest Expense) * (1 - Tax Rate) + Depreciation & Amortization., Total + Other Amortization + Capital Expenditure + Sale (Purchase) of Intangible assets - Change in Net Working Capital + Pref. Dividends Paid + Total Debt Repaid + Total Debt Issued + Repurchase of Preferred + Issuance of Preferred Stock)/ Diluted Shares Outstanding
Where: Tax Rate = 0.375
This figure is a normalized item that excludes non-recurring items and also takes into consideration cash inflows from financing activities such as debt or preferred stock issuances."
Owner Earnings Per Share (Warren Buffett's formula for measuring Free Cash Flow)
(Net Income +Depreciation, Depletion, Amortization + Certain Non Cash Items - Capital Expenditures + Changes in Working Capital)/Diluted Shares Outstanding
Actual Calculation of IBM's Owner Earnings for 2012 as an example:
Net Income = $16,604
D&A = $4,676
Other Non cash Items =$688
Cap Ex = -$4,717
Changes in Working Capital = $-2449
Therefore (16,604) +(4,676) +(688) -4,717 = $17,251
Then finally you take that 17,251 and add (not subtract) the changes in working capital =$17,251 + $2,449 = $19,700
Changes in Working Capital are calculated this way;
Increase/Decrease in receivables = $-2230
Inc/Dec in Inventories = $+280
Inc/Dec in Payables = $-224
Inc/Dec in Current Liabilities = $-1008
Inc/Dec in Other Working Capital =$+733
Changes in Working Capital = $-2,449
Diluted Shares Outstanding = 1,155
$19,700/1,155 = $17.05
Once I have determined the results for each ratio, I then add them together and divide the combined result by three, which gives me my "average" free cash flow per share. From there I then use what is called a "Two-Stage "Dividend" Discount Model" , which can be found on page 126 of "The Warren Buffett Way" by Robert G. Hagstrom.
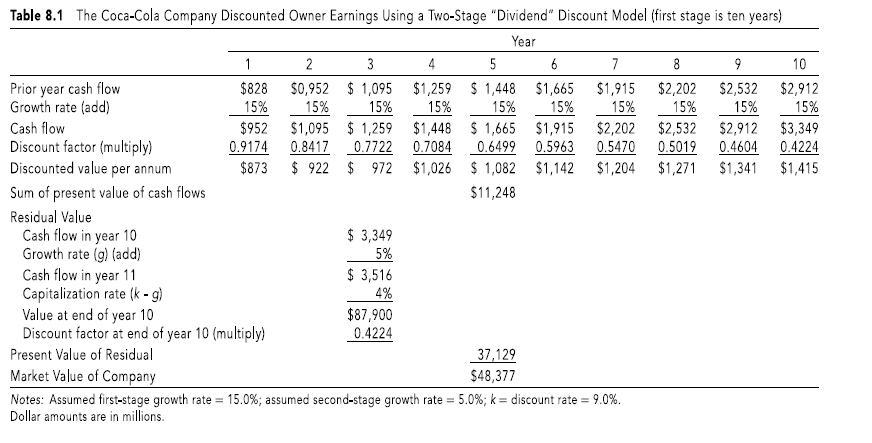 I use the exact methodology that you see above, except that I use a conservative fixed free cash flow growth rate of just 5% and use the same 9% discount rate, even though the discount rate in use right now by the analyst community is much lower. I do so because if I can find a stock with an attractive margin of safety at a higher discount rate, then I am really protecting my clients.
I determined this by reading the following from Seth Klarman's book "Margin of Safety"
"The other component of present-value analysis, choosing a discount rate, is rarely given sufficient consideration by investors. A discount rate is, in effect, the rate of interest that would make an investor indifferent between present and future dollars. Investors with a strong preference for present over future consumption or with a preference for the certainty of the present to the uncertainty of the future would use a high rate for discounting their investments. Other investors may be more willing to take a chance on forecasts holding true; they would apply a low discount rate, one that makes future cash flows nearly as valuable as today's.
There is no single correct discount rate for a set of future cash flows and no precise way to choose one. The appropriate discount rate for a particular investment depends not only on an investor's preference for present over future consumption but also on his or her own risk profile, on the perceived risk of the investment under consideration, and on the returns available from alternative investments."
Finally I also use two unique ratios to determine how efficient a company's management is:
1) Free Cash Flow Return on Invested Capital (FROIC)
Standard Free Cash Flow /Total Capital Employed
Where Total Capital = Shareholders Equity + Long Term Debt
This ratio tells us how much free cash flow is generated for every dollar of invested capital, where a result of 15% or greater is considered excellent.
2) CapFlow
Capital Spending/Cash Flow from Operations
This ratio tells us how much capital spending a company uses relative to its cash flow from operations. A result of less than 33% is considered excellent.
The final result is called the "Full Market Value" per share price, which tells us what the sell price should be per share for each stock under analysis. Having found our sell price, we then try to purchase stocks that exhibit at least a 33% discount to that price. The greater the discount, the greater the margin of safety will be.
Now that I have concluded the introduction to my system, here are the five stocks that I believe to have a large margin of safety and thus should function well as "flight to quality" stocks in the coming correction.
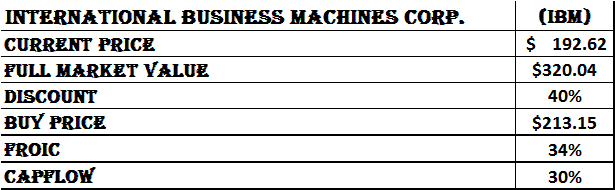
- Standard Free Cash Flow Per Share = $47.69
- Owner Earnings Per Share =$32.56
- Levered Free Cash Flow Per Share = $35.34
- Final Result = $47.69 + $32.56 + $35.34 = $115.59/3 = $38.53
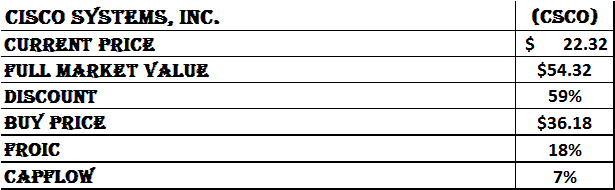
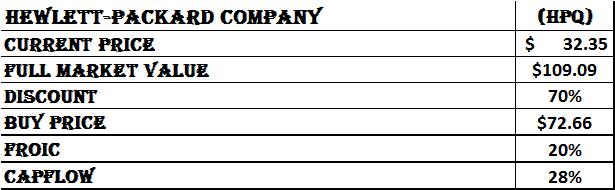
- Standard Free Cash Flow Per Share = $2.23
- Owner Earnings Per Share =$2.42
- Levered Free Cash Flow Per Share = $1.87
- Final Result = $2.23 +$2.42+$1.87 = $6.52/3 = $2.17
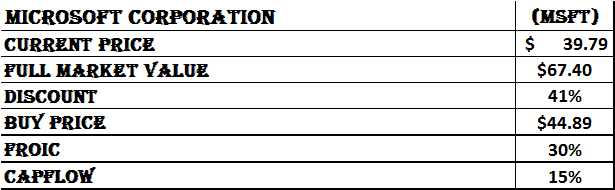
- Standard Free Cash Flow Per Share = $2.88
- Owner Earnings Per Share =$3.20
- Levered Free Cash Flow Per Share = $2.01
- Final Result = $2.88 +$3.20+$2.01 = $8.09/3 =$2.70
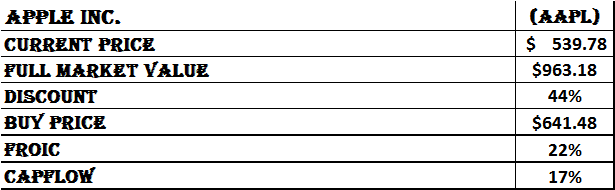
- Standard Free Cash Flow Per Share = $11.13
- Owner Earnings Per Share =$17.24
- Levered Free Cash Flow Per Share = $10.03
- Final Result = $11.13 +$17.24+$10.03 = $38.40/3 =$12.80
- Standard Free Cash Flow Per Share = $4.31
- Owner Earnings Per Share =$4.49
- Levered Free Cash Flow Per Share = $4.28
- Final Result = $4.31 +$4.49+$4.28 = $13.08/3 =$4.36
In conclusion, it has become quite clear to me, after analyzing thousands of companies, that most investors are using a very low discount rate in calculating what they believe to be the true value of their holdings and thus are operating in a best case scenario. It is my opinion that they may want to continue to hope for the best, but at the same time prepare for the worst.
Always remember that these are the results of our research based on the methodology that I have outlined above and in other articles previously published. This research is provided as an educational ...
more

