
How To Guard Against Big Losses
As grownups, we understand that at times stocks move lower. What terrifies us, however, are the big “drawdowns,” the exceptional not-just-another-correction market beat-downs that cause us to fear material and possibly lasting damage to our financial security. We can reduce the probability of this – but not by drawing on what the quants are doing.
Defining Risk – Really
Quants one way or another define risk in terms of volatility. Traditionally, risk has actually been defined as volatility, the statistical meaning of the word, which meant that investors should equally fear big moves up as well as down. Innovations occurred that recognized the differences in direction and sought to analyze downside volatility, value at risk, maximum drawdown, etc.
Bad idea. They had it right the first time. We do need to be equally fearful of upside volatility. That’s because risk is not a statistical phenomenon. It’s a fundamental phenomenon.
This means any risk-based model that is based on historical price data (as all of them are) is wrong (“mis-specified”) because it measures something that has nothing to do with the risks to which you are subjected when you buy stocks. Such metrics consist of nothing more than statistical report cards revealing how things just so happen to have played out over particular historic time period. Because they don’t dig beneath the price action, they tell us nothing about why the stock did what it did and, accordingly, provide absolutely no useful information that can help us assess how the stock might behave in the future. (In a 9/1/15 post, I cited violation of the past performance does not assure future outcomes as a major indicator of sham financial research; all of the standard risk metrics violate this principal.)
I understand and I’m all for studying the past to learn things that can support reasonable assumptions about the future (assuming, of course, we are not mindlessly data mining but understand and can explain logically why we believe the past relationships we observed are likely to persist going forward). But I don’t care about metrics based on historical prices. I care about the underlying factors that caused prices to behave the way they did.
What Causes Extreme Losses
It’s really simple. Extreme losses are caused by extreme fundamentals.
- Extreme price declines in the past might be relevant if and only if they signal extreme fundamentals of the sort that are likely to persist going forward. So, yes, momentum properly defined can be a legitimate factor. But it’s not by any stretch the only or even primary factor.
- As we found out after 2000, extreme overvaluation can be a dangerous source of mega-loss risk even if company financial strength and earning power remain great.
- Companies with extremely weak balance sheet pose serious mega-loss risk because their financial burdens increase the probability that business softness, even mild softness, can cause major earnings deterioration or even bankruptcy.
- Companies whose businesses involve heavy fixed costs of any kind pose bigger risks of mega losses because during downturns, operating expenses can’t fall far enough to match revenue declines thus leading to higher probabilities of exceptional earnings deterioration.
- Smaller companies tend to be more prone to outsized earnings declines because they are more likely to find it hard to cover fixed costs as effectively as larger companies and because they are less likely than larger companies to be able to benefit from operational diversification, in which less weak subsidiaries can diversify against declines at weaker subsidiaries.
- Companies in businesses normally subject to volatile revenue streams (e.g. gold mining companies) because probability is higher that they will experience large revenue declines leading to large earnings declines.
- Etc., etc. etc.
All such conditions also have the potential to spark outsized mega-gains when things go well. That’s why standard quant-style risk metrics are so ridiculous. The company that did something spectacular that caused its stock to triple last year is equally capable, if things break badly, of blowing up your portfolio next year. It’s the fundamentals that count. Similarly, the stock that lost 90% last year may, actually, be a big winner this year if things break better for it, and could even turn out to be a very conservative investment now if something significant about the company’s fundamentals changed for the better. Again, and I can’t say this too often, it’s the fundamentals that count.
A Quick Demo
I sorted all Russell 3000 stocks by total return over the four-weeks ended 9/18/15. I then evaluated the 100 best performers, the 100 worst performers and the middle 100 on the basis of various factors measured at the start of the four-week period:
- Quality (based on return on assets, change in turnover, earnings quality, and finances)
- Value (based on enterprise value to sales and price to free cash flow)
- Momentum (based on the last six months excluding the most recent week)
- Market Capitalization
- Share (Trading) Liquidity (controlling to market capitalization)
- Share Price
The Quality, Value, Momentum and Liquidity factors are presented in terms of multifactor Portfolio123 ranking system scores ranging from zero (worst) to 100 (best).
Table 1 shows the average factor tally for the top 100 performers, the middle 100, and the worst 100.
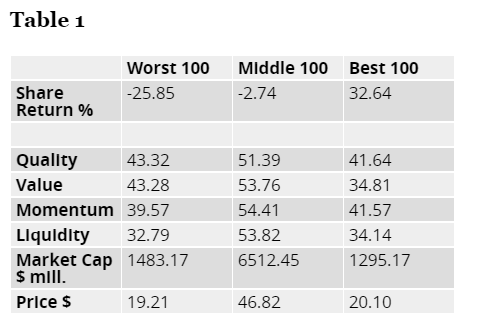
The best performers were situations in which the factors were more oriented toward the middle. Factor cores for both the best and worst performers tended to be lower.
I expected to see the best share performance associated with the middle ground in terms of Quality, Value, Momentum and Market Cap. Liquidity was interesting. I expected lesser scores to be associated with worse performance. It was intriguing, however, to see the same at the upper extreme. But on reflection, it makes sense. All else being equal, a stock should rise further if it’s harder to buy the shares forcing bulls to bid more aggressively. That relevance of the share price, separate and apart from its impact on market cap, likely owes something to elements of business and investment community culture in which larger companies are willing to let share prices rise quite a bit before splitting the stock.
By the way, I saw similar results when I looked only at S&P 500 constituents and when I examined other periods. I could go further and show more periods and groupings, as I would if this were an academic study. But for now, I think this is sufficient since what we see is so consistent with the theory of extreme price movements associated with extreme factors.
Going Forward
A more interesting follow-up, for readers who are concerned about the future and eager to mitigate the risk of extreme losses is how this can be implemented in an actionable, investable (smart alpha) portfolio strategy. I’ll cover that in my next post.
For now, I’ll sum this up by suggesting that if you’re worried about big drawdowns, draw inspiration from Aristotle’s Nicomachean Ethics (in which he describers virtue in terms of the mean between two extremes) and Chapter 9 of Lao Tzu’s Tao Teh Ching, which cautions against the danger of extremes:
Holding a cup and overfilling it
Cannot be as good as stopping short
Pounding a blade and sharpening it
Cannot be kept for long
Gold and jade fill up the room
No one is able to protect them
Wealth and position bring arrogances
And leave disasters upon oneself
When achievement is completed,
Fame is attained
Withdraw oneself
This is the Tao of Heaven
Translation by Derek Lin (SkyLights Paths Publishing2006).
Disclosure: None.


