
How To Estimate A Growth Rate For Stocks
In any valuation of common stock, estimating the growth rate is a key factor. It seems that every possible formula for determining a company’s intrinsic value relies heavily on a growth variable. As such, intelligent investors must place great emphasis on utilizing an effective and reliable method of estimating growth.
In this article we will explore various approaches to estimating growth, providing examples of each, and then explain the ModernGraham approach to the problem of growth rates.
Analyst Estimates
The easiest way to select a growth rate for a company is to utilize the analyst estimates. Analysts will regularly provide estimates for earnings growth over the next five years. For example, here is a screenshot from Yahoo Finance’s Analyst Estimates page for Microsoft Corporation (MSFT):
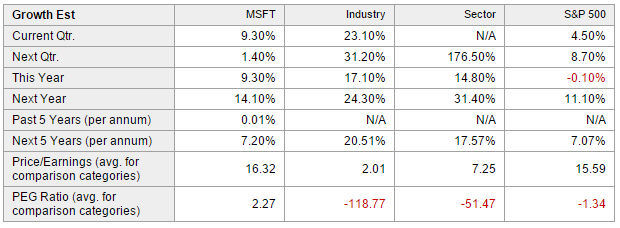
As you can see, Yahoo Finance has provided an aggregate growth estimate for Microsoft of 7.2% per year for the next five years. Also shown for reference purposes are the annual growth rate over the last five years, and current figures.
Using the analyst estimates can be very easy and quick, so it might be a possible approach for Defensive Investors, those who are not willing to spend much time conducting research, but it does have some limitations. Analysts are often wrong when estimating earnings, as evidenced by the next image showing the recent quarterly earnings results compared to the analyst estimates (taken from the same page as the last image):
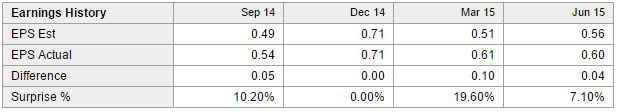
So, you can see that using an analyst estimate for growth may be simple but it could be inaccurate. Given that you do not know the assumptions that went into the analyst’s estimate, it may be better to make your own assumptions and calculations. After all, you may end up being just as inaccurate as the analysts, but at the very least you will understand what went into the equation.
Basic formula for growth
The first step in estimating a growth rate is to understand the basic formula for calculating a growth rate. In simple math, a growth rate is calculated by taking the change in figures divided by the original figure. In other words:
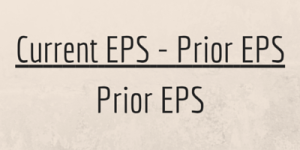
If that wasn’t clear, then let’s go back to Microsoft. Based on the financial statements listed on GuruFocus, Microsoft’s EPS for 2013 was $2.58 and for 2012 it was $2.00. So, to calculate the basic growth rate from 2012 to 2013, you should take $2.58 – $2.00, which equals $0.58, and divide that by $2.00. The result is a growth rate of 29%.
Average growth over a period of time
There are limitations to using a growth rate for any given year, though. Continuing our Microsoft example, the company’s EPS in 2014 was $2.63, so the growth rate was only ($2.63 – $2.58) / $2.58 = 1.9%. Going further, in 2015 the company’s EPS was only $1.48 so the growth rate was negative: ($1.48 – $2.63) / $2.63 = -43.7%. So over the last three years, Microsoft’s annual earnings have been:
| Year | EPS | Growth Rate |
| 2012 | $2.00 | |
| 2013 | $2.58 | 29.0% |
| 2014 | $2.63 | 1.9% |
| 2015 | $1.49 | -43.3% |
Clearly there can be great fluctuation in growth from year to year, so how do you smooth that out in order to get a good estimate for the future? By using an average growth rate over a period of time. There are a few different ways to accomplish this, and we’ll start with the basic average.
Let’s look at Microsoft’s EPS over the last ten years:
| Year | EPS | Annual Growth Rate |
| 2006 | $1.20 | |
| 2007 | $1.42 | 18.3% |
| 2008 | $1.87 | 31.7% |
| 2009 | $1.62 | -13.4% |
| 2010 | $2.10 | 29.6% |
| 2011 | $2.69 | 28.1% |
| 2012 | $2.00 | -25.7% |
| 2013 | $2.58 | 29.0% |
| 2014 | $2.63 | 1.9% |
| 2015 | $1.49 | -43.3% |
The most basic way to calculate an annual growth rate over a period of time is to take the growth in earnings from the first year to the last year, then divide by the number of years. This is similar to the calculation from the previous year to the next. For example, if we want to determine the average annual growth rate for Microsoft from 2006 to 2015, we would take ($1.49 – $1.20) / $1.20 = 24.2% and then divide that over the nine year period, for an average annual growth rate of 2.69%.
Once again there are limitations to this approach, as you are still subject to potentially wide fluctuations in annual EPS. For example, if the company sees a very abnormally high EPS figure in one year and just so happens to have a very abnormally low EPS figure ten years later, then you may end up with an average growth rate that is negative even though the company’s EPS have shown growth over normal years. In addition, this approach does not take into effect the compounding effect of growth, so it does not provide the best estimate of the average growth rate over the period of time.
A more accurate way to calculate an average return over a period of time is to take the Compound Annual Growth Rate (CAGR). CAGR is calculated using the same figures but a slightly modified formula:
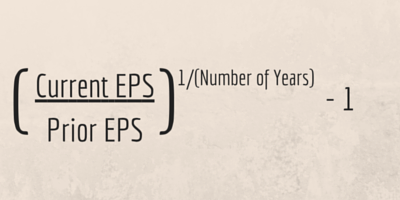
For Microsoft, we would then calculate ($1.49 / $1.20) = 1.24, take that to the power of 1/9 = 1.0242, and subtract 1 = .0242, or 2.42% CAGR over the ten year period. You will notice this rate is slightly lower than the basic average annual growth rate, and that is because the CAGR takes into account the power of compounding growth. Once again, though, the approach is limited in that it is subject to the possibility of abnormal earnings in either the beginning year or the ending year. For example, if you look at the CAGR for the period of 2007 to 2014, ($2.63 / $1.42) ^ (1/7) – 1 = 9.21%. There is a big difference in the CAGR just due to using a different time frame.
Dividend growth rate
An alternative approach to calculating the company’s overall growth rate may be to calculate the dividend growth rate. This approach operates under the assumption that if the company is growing its dividends, then the company itself is growing. Of course there are some flaws in the assumption in that management may be growing the dividend despite a lack of earnings growth or management may simply be increasing the payout ratio. However, let’s see how this approach plays out with Microsoft. First, let’s look at Microsoft’s dividend history over the last ten years:
| Year | Dividend Per Share |
| 2006 | $0.34 |
| 2007 | $0.39 |
| 2008 | $0.43 |
| 2009 | $0.50 |
| 2010 | $0.52 |
| 2011 | $0.61 |
| 2012 | $0.76 |
| 2013 | $0.89 |
| 2014 | $1.07 |
| 2015 | $1.21 |
From 2006 to 2015, the dividends per share increased from $0.34 to $1.21. Thus, in order to estimate a growth rate using the growth in dividends, we can use the CAGR formula to find the CAGR is:
($1.21/$0.34)^(1/9) – 1 = 15.15%
At first glance we notice a huge difference in the dividend growth rate (15.15%) compared to the CAGR of the earnings (2.42%). This could be demonstrative of the problems inherent in using a single year’s earnings, and it is possible that using the growth in dividends may be a more consistent method of determining the growth rate. But again, the approach is somewhat flawed because it relies on the assumption that management is raising dividends purely based on the company’s overall growth rather than for other reasons.
Using Return on Equity
Related to the dividend growth approach is to utilize the payout ratio along with the return on equity. The payout ratio is a ratio demonstrating the amount of the earnings which are paid out in dividends. Return on Equity is the amount of net income returned to shareholder’s equity. Used in tandem, the two figures can help to estimate growth as follows:
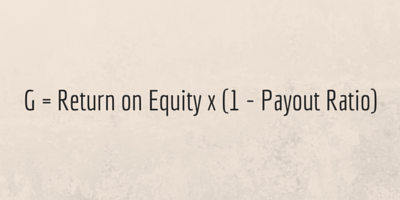
So, one could estimate Microsoft’s growth rate by taking its average Return on Equity and its average Payout Ratio over the time period. Here are those figures for 2006 – 2015:
| Year | Return on Equity | Payout Ratio |
| 2006 | 28.56 | 0.28 |
| 2007 | 39.51 | 0.28 |
| 2008 | 52.48 | 0.23 |
| 2009 | 38.42 | 0.31 |
| 2010 | 43.76 | 0.25 |
| 2011 | 44.84 | 0.23 |
| 2012 | 27.51 | 0.38 |
| 2013 | 30.09 | 0.35 |
| 2014 | 26.17 | 0.41 |
| 2015 | 14.36 | 0.82 |
| Average | 34.57 | 0.354 |
So, our growth estimate using this method is: 34.57 x (1 – 0.354) = 22.33%. Once again we’ve come to a figure vastly different from the other methods, but this approach does avoid the problems of abnormal earnings, as it takes into account a long-term average Return on Equity and a long-term average Payout Ratio.
Benjamin Graham’s Recommended Method
Benjamin Graham recognized that growth is a key element in determining the intrinsic value of a company. In fact, he said, “It is of prime importance that the growth factor in a company’s record be taken adequately into account.” He recommended that “the growth rate itself be calculated by comparing the average of the last three years with corresponding figures ten years earlier.” This suggested approach is directly related to Graham’s suggestion that Defensive Investors require a company to have shown at least 33% growth in earnings using a three year average from the beginning of a ten year period versus a three year average from the end of a ten year period.
For Microsoft, the averages to use would be for the periods 2005-2007, which is $1.25, and 2013-2015, which is $2.23. So the overall growth shown in earnings during the ten year period is ($2.23 – $1.25) / $1.25 = 78.4%. Using these figures we can then calculate an average annual growth rate of 7.84% or a CAGR of 5.96%.
Graham’s method is somewhat solid even today, since it utilizes average earnings to lessen the potential impact of abnormal earnings, but it could still lead to abnormal earnings having an impact as the period being averaged is only three years.
ModernGraham Estimates of Growth
The ModernGraham approach to estimating growth is related to Graham’s suggestion, with a few changes. Overall, it is a three-step process:
- Calculate Earnings Per Share – ModernGraham (EPSmg) for the current year as well as the EPSmg for five years prior.
- Calculate the average growth rate for the five year period.
- Reduce the growth rate based on margins of safety.
EPSmg is a normalized earnings figure taking into account five years worth of EPS figures. The formula is a weighted-average using the sum-of-the-years-digits method. So, for Microsoft, the EPSmg for 2015 is calculated using the following EPS figures and the corresponding weights:
| Year | EPS | Weight |
| 2011 | $2.69 | 1/15 |
| 2012 | $2.00 | 2/15 |
| 2013 | $2.58 | 3/15 |
| 2014 | $2.63 | 4/15 |
| 2015 | $1.49 | 5/15 |
| EPSmg | $2.16 |
We use a similar approach to calculate the EPSmg from five years prior, which is $2.12.
Next, we calculate the average growth rate for the five year period, taking ($2.16 – $2.12) / $2.12 = 1.89%, divided by 5 = 0.37%. This is the actual average growth rate in EPSmg that Microsoft has seen from 2011 to 2015.
Benjamin Graham was a very big proponent of utilizing margins of safety in order to maximize the reliability of calculations, because there is always going to be some inherent difficulty in calculating values and growth rates. But if the intelligent investor uses a margins of safety that allows some flexibility to be wrong about the result and still have room for profit.
ModernGraham uses two margins of safety with regard to the growth rate estimate. First, we assume that no company can achieve a long-term growth rate greater than 15% annually. As a result, our growth estimate is limited to a maximum of 15%. If a company’s actual growth rate is greater than that, we will use a 15% growth rate as the estimate going forward.
Second, the actual calculated growth rate in EPSmg is reduced to 0.75 of the rate. For example, the 0.37% rate we estimated would then be reduced to 0.28%. This allows some room for error in the end result.
Overall, it is clear that the ModernGraham approach to estimating growth is generally a very conservative method. We feel comfortable in this fact because of the high level of importance of growth rates in estimating intrinsic value. After all, it would be much better to estimate a low intrinsic value and have the actual value be much higher than the alternative.
So, what approach to estimating growth do you use?
As you can see, there are many different ways to estimate growth, with a wide variety of results. What approach do you use? Leave a comment below with your methods.
Disclaimer: more


