
Have We Reached The EM Inflection Point?
Following a long wait, 2017 was the year that being a globally diversified investor finally seemed to pay off. The MSCI ACWI ex USA Index beat the S&P 500 by more than 500 basis points (bps), outperforming for the first time since 2012. Many wondered if the baton was finally being passed to the international markets—after a decade of lagging the U.S.—to lead us into the next stage of the global equity rally.
Funny how quickly things can change.
It seems like a long time ago, but for the first four months of 2018, the U.S., the EAFE region (consisting of Europe, Australasia and the Far East) and emerging markets (EM) regions all performed almost exactly in line with each other. Since then, a massive gap has emerged. Over the last six months, the S&P has beaten the MSCI ACWI ex USA Index by more than 14.5%—a performance gap that falls into the top decile of history.
Looking at EM, the difference has been even more stark, with a nearly 20% gap between the two regions in just six months—in the 92nd percentile of history!1 Outside of the Asian debt crisis in the late 1990s, outperformance of this magnitude has not tended to last long; given the stark differences in fundamentals in the asset class between now and then, it seems reasonable to believe an eventual reversion to the mean will arrive.
S&P 500 – MSCI Emerging Markets Trailing Six-Month Performance
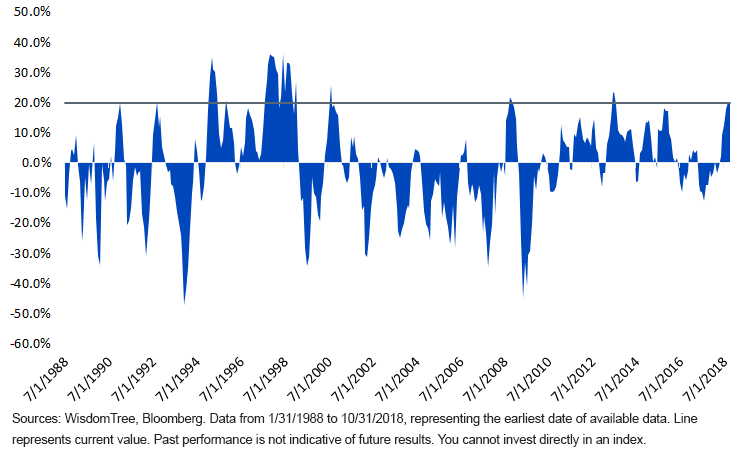
Was October 2018 an Inflection Point?
Even with the recent U.S. outperformance, there are some signs that the divergence momentum has slowed. The S&P 500 lost 6.8% in October, its worst month since September 2011. October seemed like an inflection point in the U.S. markets, with sentiment shifting away from what had previously done well:
- Technology and Consumer Discretionary, the main drivers of the market over the last few years and the two best-performing sectors year-to-date through September, both lagged on the downside.
- All FAANG stocks except for Apple underperformed
- The MSCI USA Momentum Index trailed the S&P by nearly 300 bps.
This contrasts with international markets, where, on a local currency basis, the MSCI ACWI ex USA Index performed exactly in line with the S&P. For most of the year, the escalating trade war had been priced into international equities but not the U.S. To many, it felt like October may have changed that.
Valuations Following Performance
Meanwhile, mirroring this year’s widening performance gaps between the U.S. and international markets have been widening valuation differentials. The MSCI EAFE Index, which has historically traded at an average 5% price/earnings (P/E) premium to the U.S. market, now stands at a 30% discount. Japan remains priced near developing world levels at a 38% discount to the U.S.
And speaking of which, EM now stands at a 39% discount to the U.S., around the widest it has been since 2003. Valuation tends to be one of the best predictors of forward performance, and that certainly has historically held true in EM. In fact, at today’s valuation levels, EM has historically outperformed the U.S. 96% of time over the next five years, by an average of 16% annually.2
Valuation’s Impact on Returns
In addition to helping improve forward return probabilities, managing risk and presenting attractive entry points, we think reduced valuations are important for another, less recognized reason: volatility. Beta is a crucial concept, but valuation impacts beta. That is, when an asset is more richly priced, it will tend to have a higher relative volatility than normally expected (and vice versa).
For a real-time case study of this concept, consider October. The MSCI Emerging Markets Index has typically had a standard deviation of 1.5x that of the S&P 500, and one might expect that relationship to hold in such a violent month. However, instead of the implied double-digit loss, EM lagged the U.S. by less than 190 bps (and less than 100 bps on a local currency basis). Admittedly, this is a small victory in an even smaller sample size, but it echoes what has often been the case in times when EM was less expensive relative to the U.S.: Looking at some of the most inexpensive time periods over the asset class’s history, even the short-term returns have tended to favor EM.
Given how the international markets in general and EM specifically have been beaten down so badly over the past few months, it is possible that going forward, the risks are more skewed to the upside.
S&P 500 and EM Performance in 10 Largest Monthly P/E Discounts
Solutions for Getting Back In
The fact that EM earnings have remained resilient (with double-digit earnings growth this year, unaided by corporate tax cuts) and that the newly split Congress in the U.S. may help slow the upward trajectory of the dollar, we remain constructive and opportunistic on the asset class.
For investors thinking about dipping back into the EM water, we think having a view on currencies is key. In the 2018 EM sell-off, currencies have represented one-third of the negative total return (-5.3% of -15.7%3). This compares with the 22% average contribution from currencies in previous EM corrections,4meaning that currency losses have been more of a drag on performance than normal.
While strategically hedging EM currency exposure is far too expensive in many countries, we think that tactically it can add value, particularly in today’s environment. Our recently launched WisdomTree Emerging Markets Multifactor Fund (EMMF) can dynamically hedge individual EM currencies based off momentum signals (and currently sits at about 85% hedged to the dollar5). This ability to hedge in market downturns has already paid off nicely as it beat the MSCI Emerging Markets Index by 1.4% in October’s volatility.
If investors are ready to take the full dive back into the asset class on an unhedged basis, we believe the WisdomTree Emerging Markets ex-State-Owned Enterprises Fund (XSOE) is a superior core allocation to traditional cap-weighted options.
If the upward trend that we think may be right around the corner does arrive, we believe both the alpha-seeking potential of EMMF or the better beta solution of XSOE should be well positioned to take advantage.
Unless otherwise indicated, all data is as of Bloomberg as of 10/31/2018.
1WisdomTree, Bloomberg, as of 10/31/18.
2WisdomTree, FactSet, Bloomberg, as of 10/31/18.
3Bloomberg, as of 10/31/2018.
4UBS Global Research, 7/10/2018.
5As of 11/6/2018.
Disclaimer: Investors should carefully consider the investment objectives, risks, charges and expenses of the Funds before investing. U.S. investors only: To obtain a prospectus containing this ...
more

