
General Electric (GE) Bullish Price Outlook
General Electric Company (GE) is a diversified technology and financial services company and is listed on the New York Stock Exchange (NYSE) with a market capitalisation of around $290 billion. Price last traded at $30.92.
Let’s begin the analysis by looking at the big picture with the yearly chart.
GE YEARLY CHART
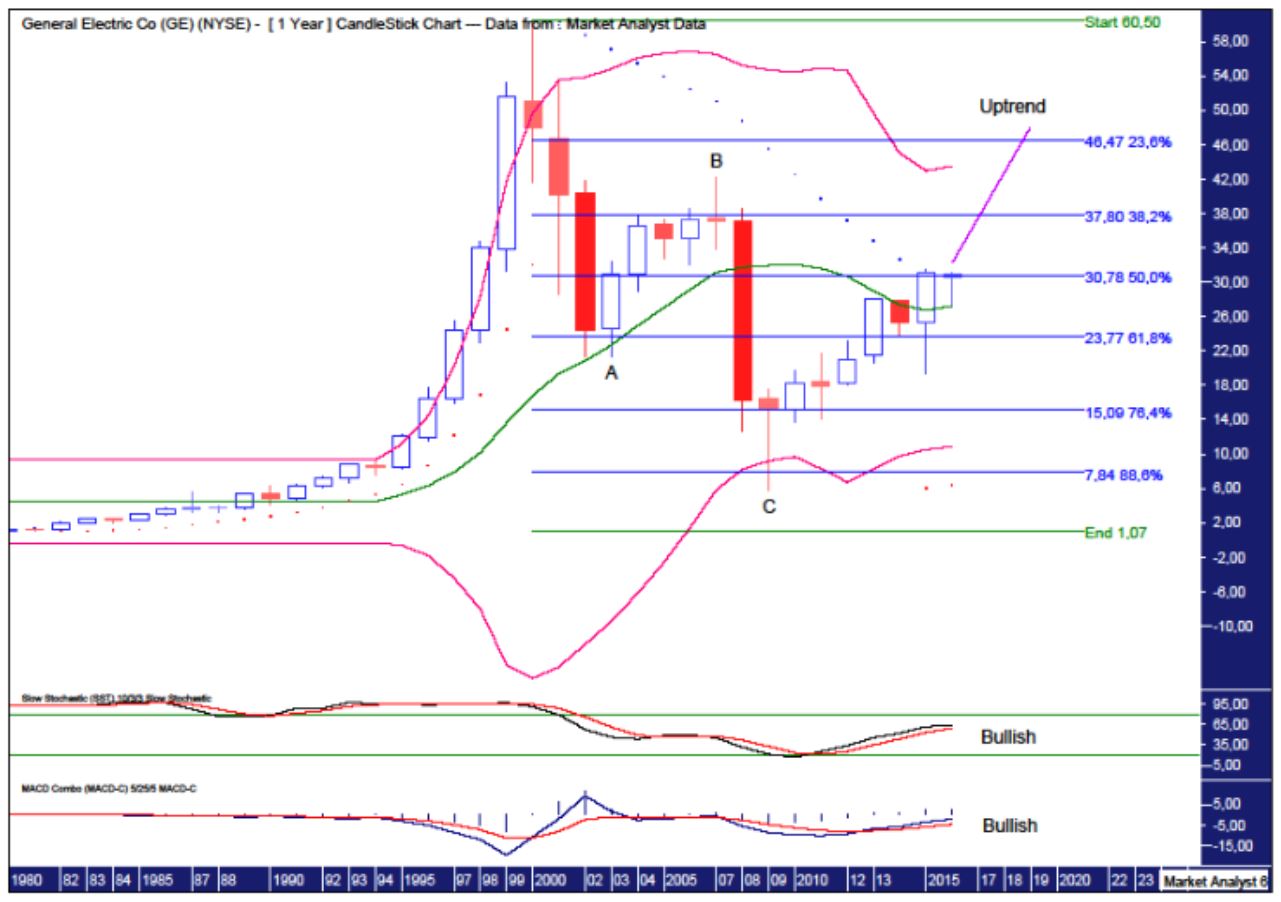
We can see a parabolic move up into the all time high which subsequently led to what appears to be an ABC corrective formation. That would imply price is now set to trade to new all time highs. I’m not so sure about that, however I do favour a move back up to test the high which stands at $60.50.
The Bollinger Bands show the wave C low bounced right off the lower band and I expect price to eventually bounce back up to the upper band. Price is now currently just above the middle band but I expect some more work to be done around this middle band with price to dip back beneath it before resume higher once again. This means the yearly low is likely still in front of us.
The PSAR indicator is bullish after price busted the dots on the upside last year.
I have added Fibonacci retracement levels of the whole move higher into the all time high and price did indeed make a deep retracement by clipping the 88.6% level. Price is currently back around the 50% level which looks to be providing some resistance. I expect after one last little dip lower this resistance will give way.
The Stochastic and MACD indicators are both bullish.
Let’s move on to the monthly chart.
GE MONTHLY CHART
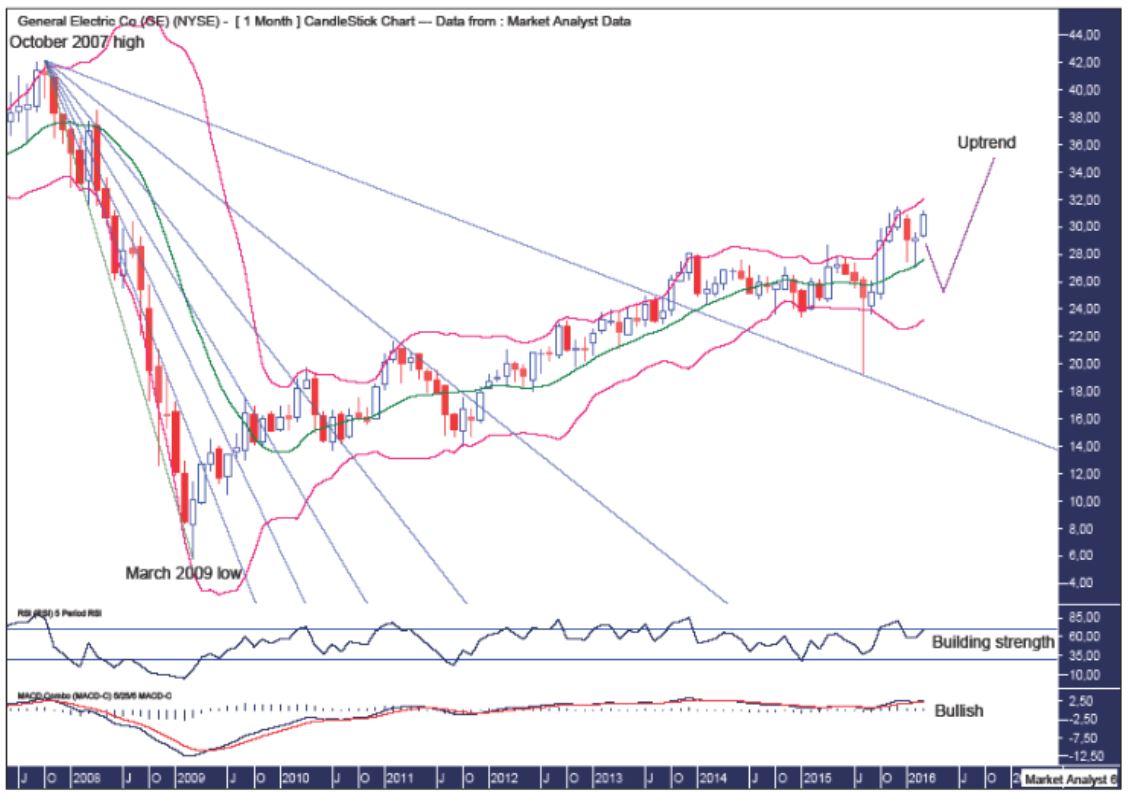
The RSI looks to be building strength with a pattern of higher highs and higher lows developing while the MACD indicator is bullish.
The Bollinger Bands show the recent low spiked well below the lower band before reversing straight back up in bullish style. Price now looks to be trading between the middle and upper bands however I favour a move back to below the middle band and possibly back to the lower band before the uptrend resumes with authority.
I have drawn a Fibonacci Fan from the October 2007 high to March 2009 low. This shows price finding some resistance around the 61.8% and 76.4% angles before heading directly for the 88.6% angle. Price moved bullishly through this angle before the spiking down last year with the low bang on support from this angle. Nice.
Let’s wrap things up with the weekly chart where we will try to determine a decent area to enter long positions.
GE WEEKLY CHART
Before we get to the present, let’s review the past to get an idea of how price is behaving.
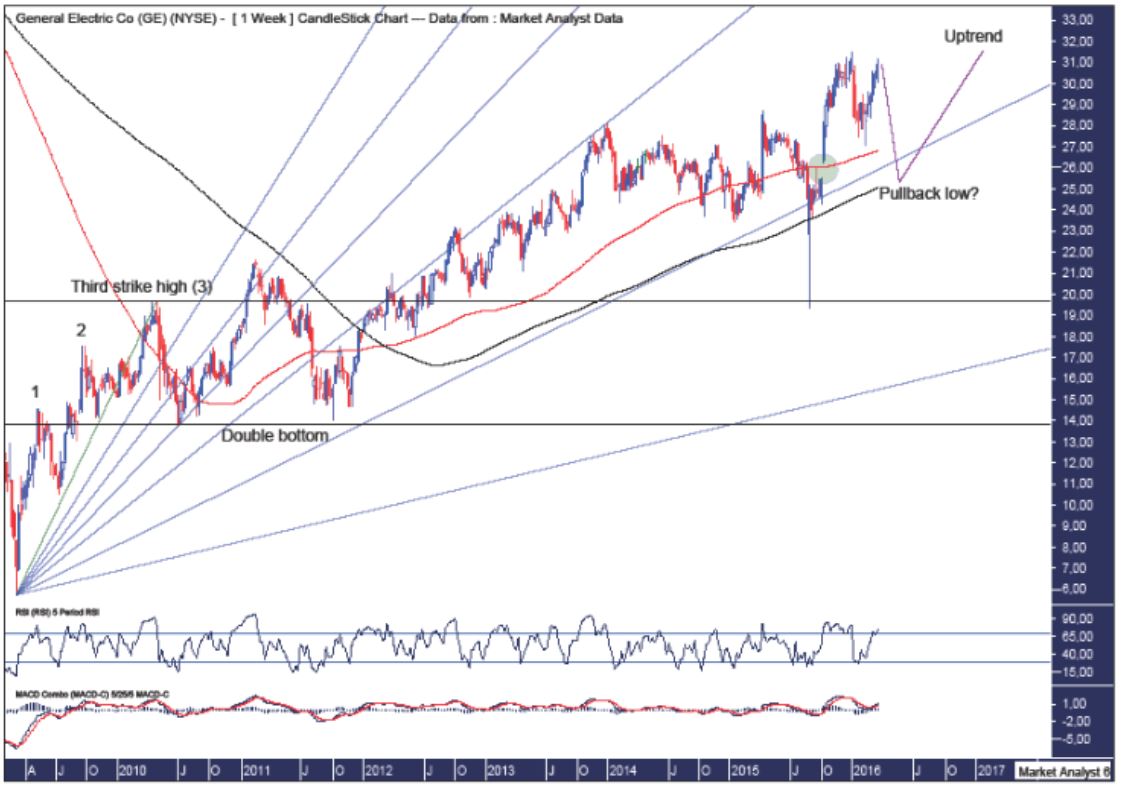
We can see after the low price traded up forming a “three strikes and you’re out” topping formation. Price subsequently traded back down breaking below the previous swing low from the second strike high. Support then came in a sent price to new highs before coming back down and finding support around the previous swing low. This set up a bullish double bottom, which is denoted by the lower horizontal line, and so it was no surprise to see price move up strongly from there.
Old highs often provide support in the future and the spike low last year was right around support from the third strike high level which is denoted by the upper horizontal line. Nice.
I have added moving averages with time periods of 100 (red) and 200 (black) and these are in bullish formation with the red line above the black line. I am looking for price to come back to one of these lines where I expect support to come back in.
I have drawn a Fibonacci Fan from the low to third strike high. This shows price generally trading higher between the 61.8% and 76.4% angles and I expect a pullback to the 76.4% angle before the uptrend resumes.
The green highlighted circle denotes a gap and I am looking for price to come back to fill in this gap which stands around the $25 to $26 levels. Price may even nudge a touch lower.
The RSI is back in overbought territory while the MACD is bullish but I suspect some oscillating action is ahead.
Summing up, I believe a good buying opportunity is set to occur after a pullback over the coming weeks.
Disclosure: I have no financial interest in GE.
Disclaimer: The above is a matter of opinion provided for general information purposes only ...
more

