
Disney Bullish Sequence Looking For New All-Time High
In the recent 3 years, Disney stock price (NYSE: DIS) hovered between $120 and $90 without any real trending momentum. Last year, we looked for a potential break to new all-time highs at Disney based on a few scenarios which seem to be still playing out.
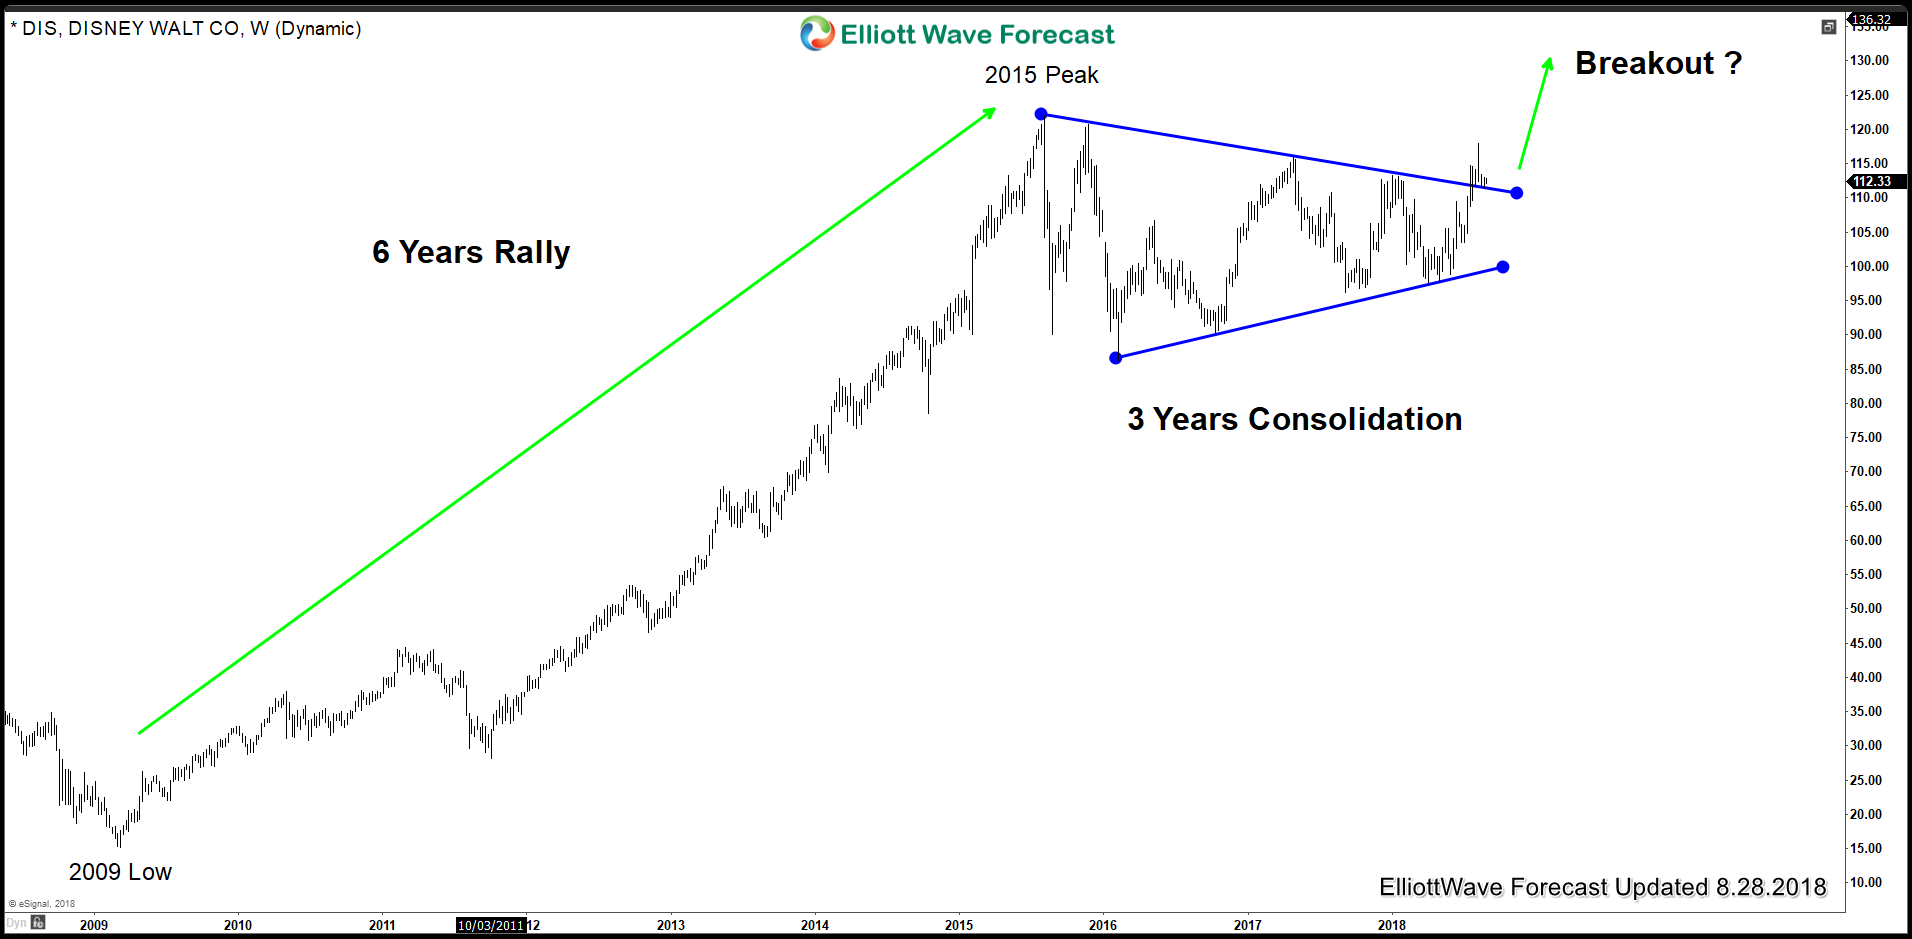
Taking a look at the weekly chart, we can consider the 3 years as a consolidation period of time after a strong 6 years of the rally. Therefore, we expect the stock to do a breakout to the upside following this bullish flag type of structure.
Disney DIS Weekly Breakout Chart
(Click on image to enlarge)
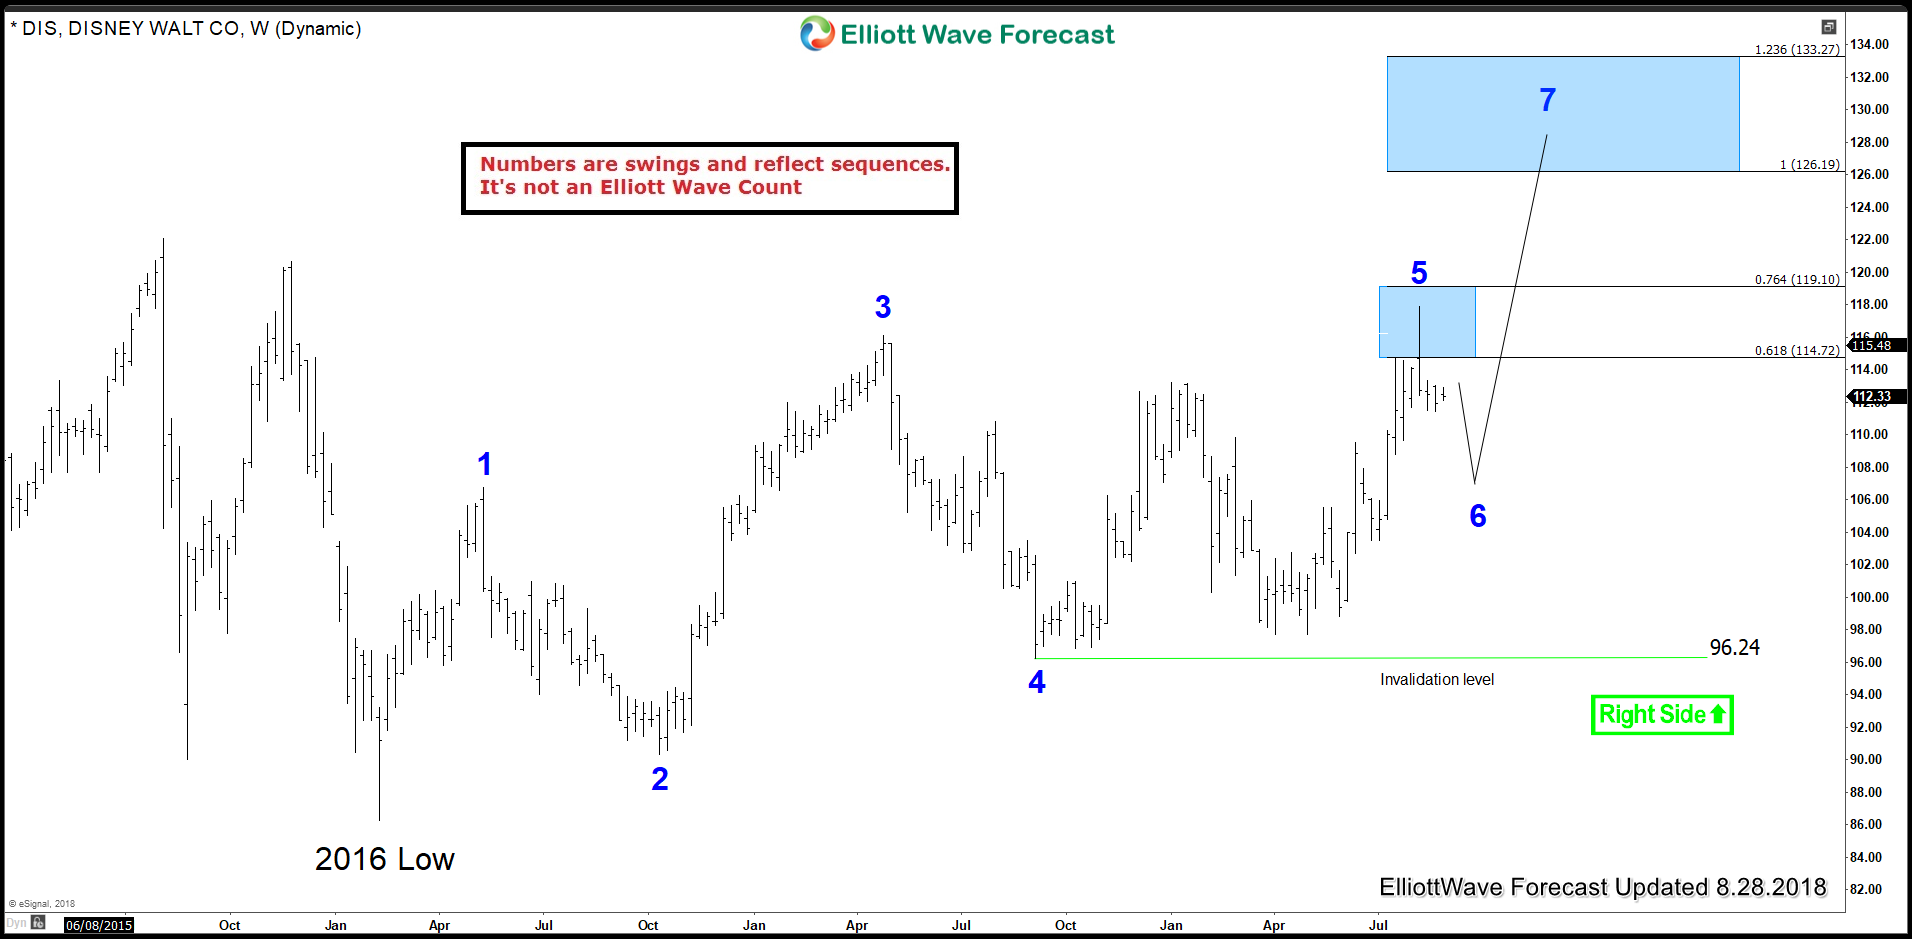
In the Elliott wave Forecast, we use the swing sequence count alongside other tools to define the current trend and cycles allowing us to remain on the right side. Counting the swings for Disney since 2016 low, we can see that it’s showing an incomplete 5 swings bullish sequence and looking to extend higher toward $126 – $133 as a daily target as long as pullbacks remain above $96.2 low.
Disney DIS Swings Sequence
(Click on image to enlarge)
Now, as we have a bullish sequence for DIS suggesting a move higher to new all-time highs, then we can use the Elliott Wave Theory structures to define the current move.
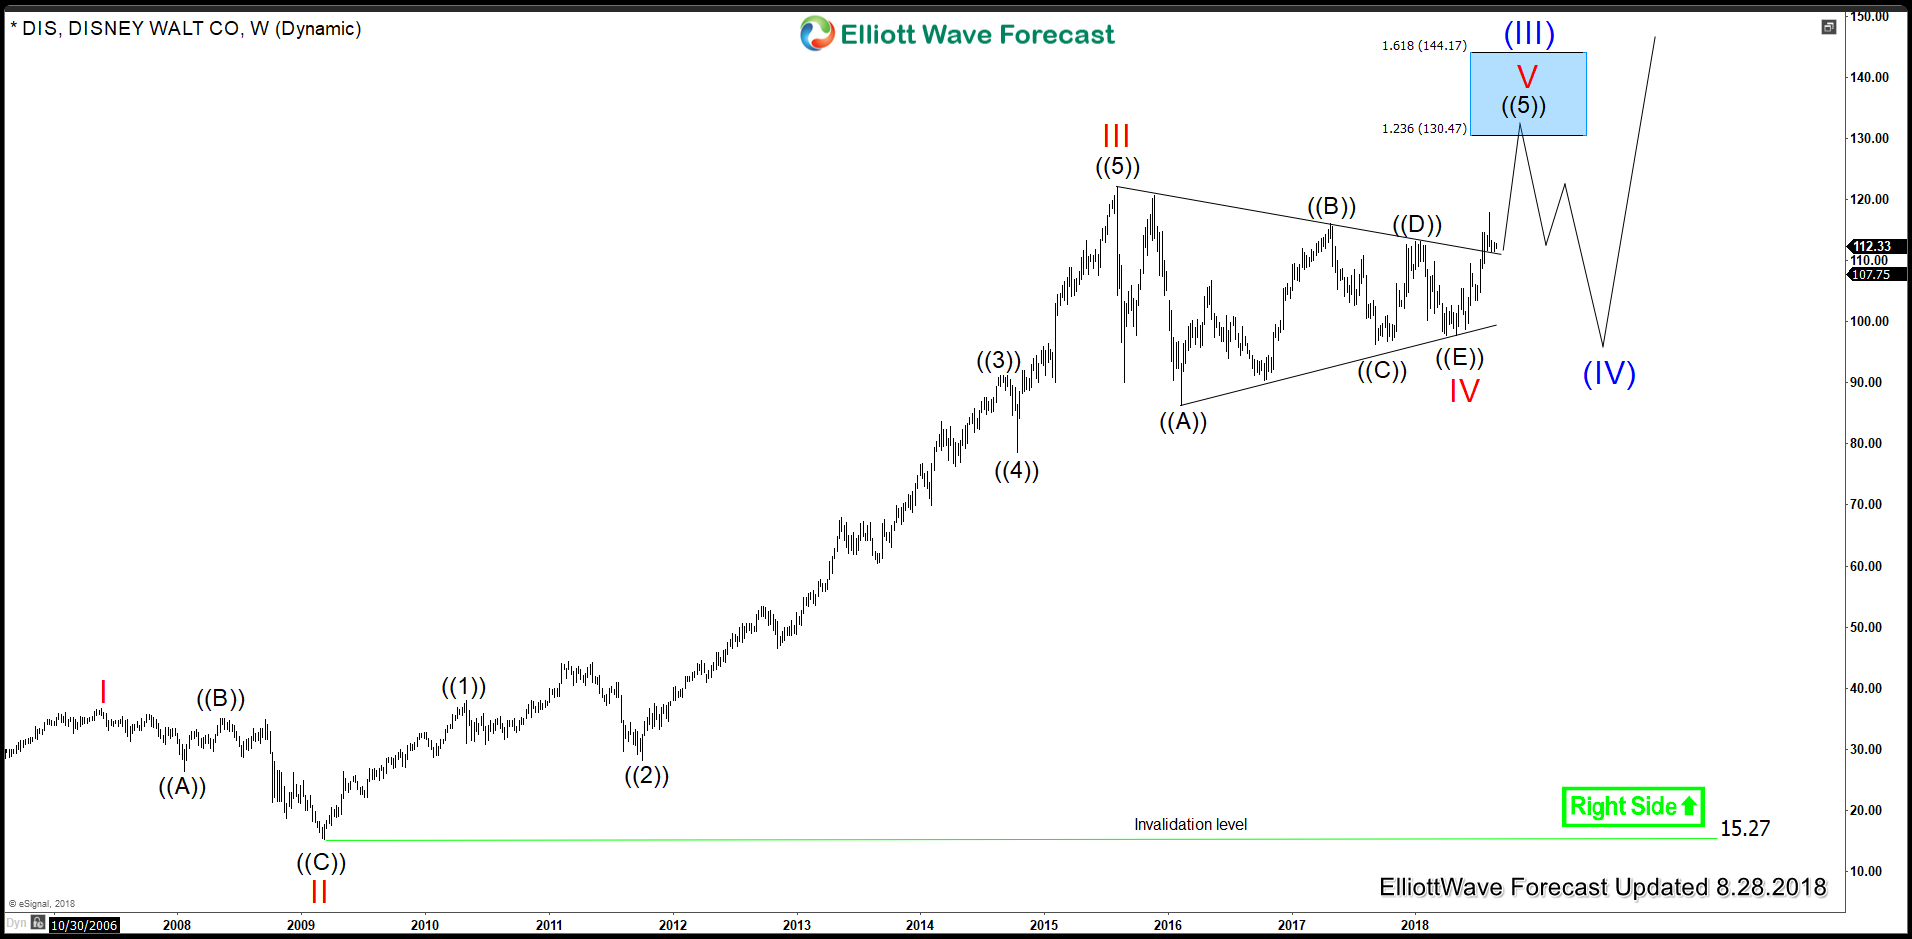
Usually, this type of consolidation happens during a bullish triangle in the 4th wave of an impulsive structure suggesting that the next leg higher could be a final acceleration before a cycle ends followed by another 3 waves pullback. In the case of Disney, the next target for a wave V would take it higher toward $130 – $144 area which would be achieved with a clear 5 wave move to the upside.
Disney DIS Triangle wave IV Chart
(Click on image to enlarge)
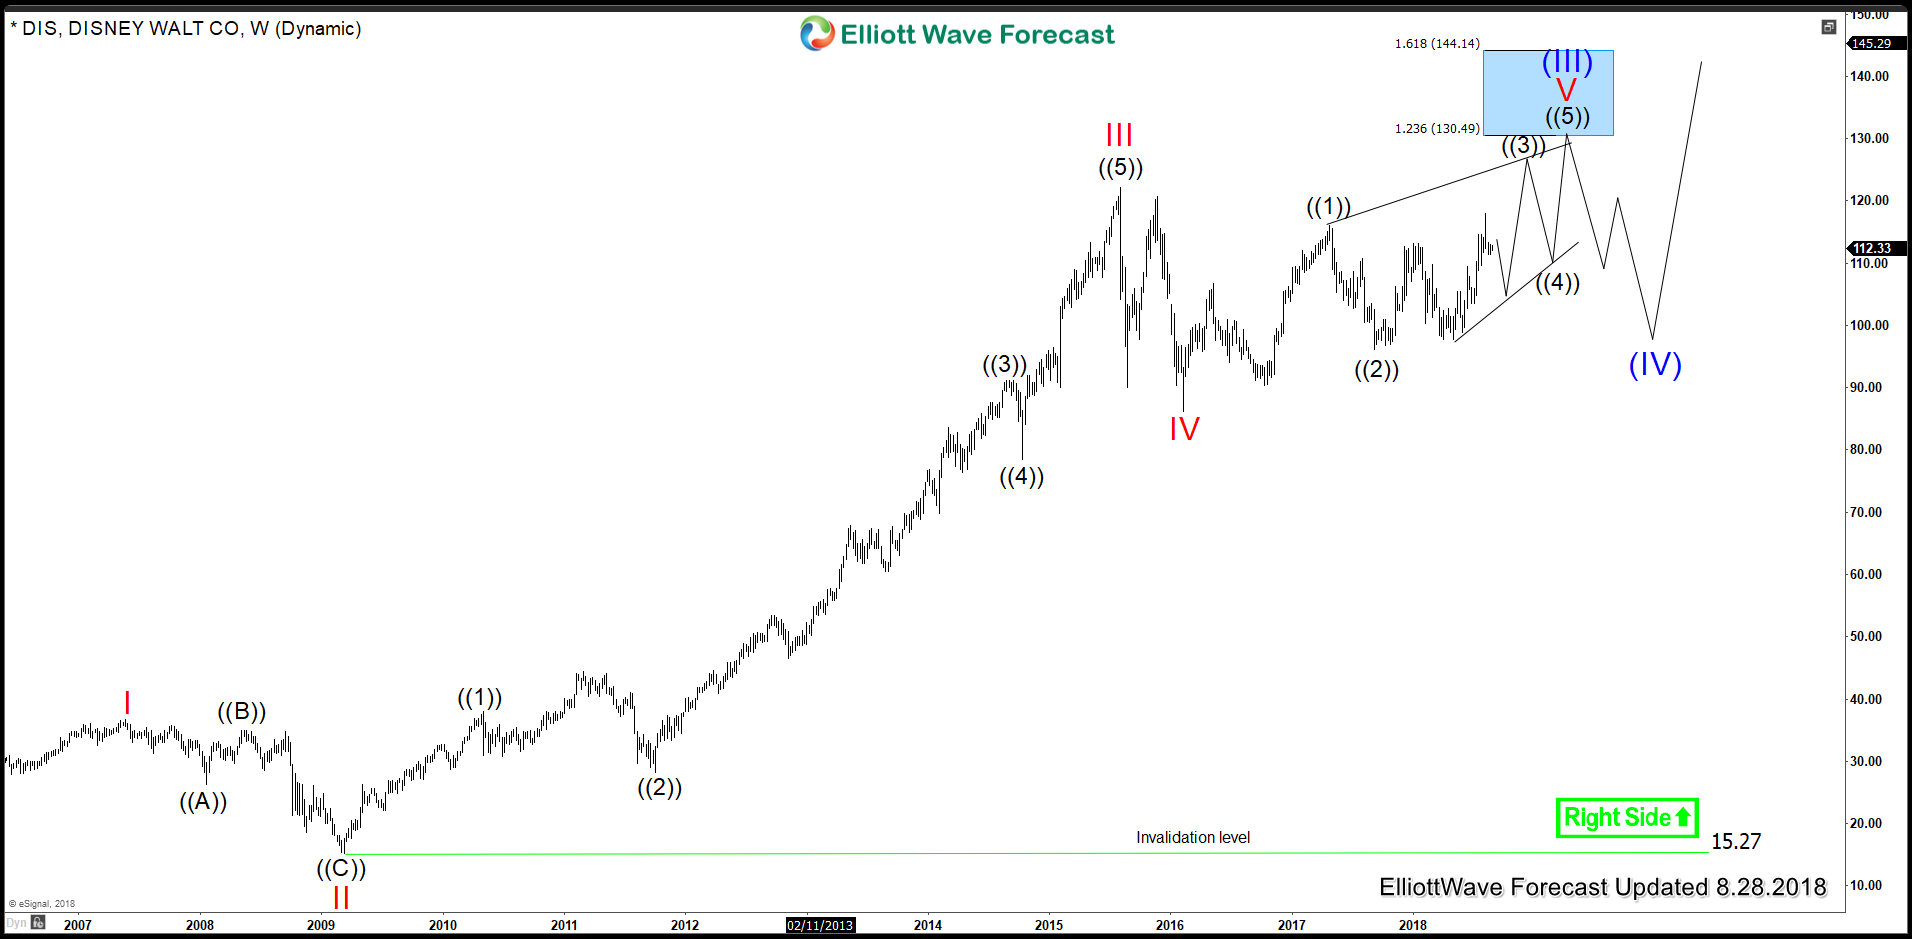
However, looking at the current structure since 2016 low, DIS could be doing a 5 waves ending diagonal as well with the same target around $130 area suggestion more time before reaching the final target to end that cycle.
Disney DIS Diagonal wave V Chart
(Click on image to enlarge)
Recap
Disney (DIS) showing a bullish sequence since 2016 low looking to trade higher and break 2015 peak toward $130 as a minimum target before another correction takes place.
Disclaimer: Futures, options, and over the counter foreign exchange products may involve substantial risk and may not be suitable for all investors. Leverage can work against you as well as for ...
more


Many thanks Sir