
Coca-Cola’s Growth Potential & Market Share
Updated January 14th, 2017 by The Financial Canadian
Coca-Cola (KO) is the gold standard in the beverage industry.
The company is the largest seller of non-alcoholic beverages in the world.
Coca-Cola operates a tremendously strong business model. This is evident in their dividend history.
With 54 years of consecutive dividend increases and counting, Coca-Cola is a Dividend Aristocrat (25+ years of rising dividends) and a Dividend King (50+ years of rising dividends).
Coca-Cola is one of 18 businesses with 50+ years of consecutive dividend raises. Click here to download your free detailed Dividend Kings Excel Spreadsheet so you can see other businesses with strong and durable competitive advantages like Coca-Cola.
This level of dividend growth would not exist unless the company operated a recession resistant business model with distinct competitive advantages and a wide economic moat.
That being said, there are some that believe that Coca-Cola’s best days are behind it. Soda sales have dropped for 11 straight years. Fiscal 2015 fanned this flame, as investors watched total revenues fall 4% and operating profits drop by 10%.
In short, many believe that Coca-Cola is on the decline. This is not the case.
In fact, the company still has plenty of room to grow. The beverage industry is expected to increase by $300 billion between 2015 and 2020, and the company continues to hold dominant market share.
This article examines Coca-Cola’s growth potential and market share in detail.
Historical Growth
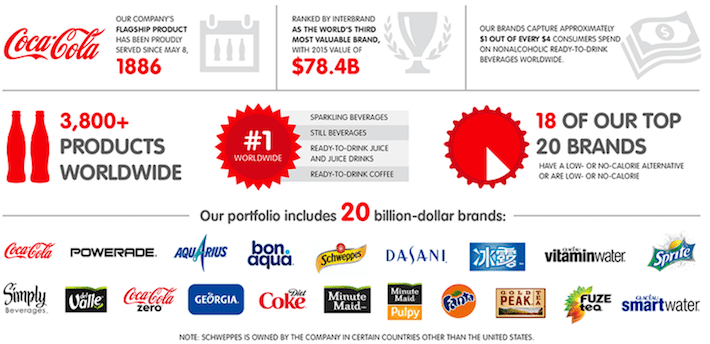
Coca-Cola can trace its humble beginnings to Atlanta, Georgia, where the company’s first soda was created by John S. Pemberton to be sold at the small local pharmacy called Jacobs’ Pharmacy. The year was 1886.
In the first year, nine drinks per day were sold, a far cry from the operations of today’s company.
The company’s accountant, Frank Robinson, thought that the two ‘C’s would look well in advertising and named the product Coca-Cola. Mr. Robinson is also credited with creating the famous cursive Coca-Cola logo, which is still in use today.

Source: The History of Coca-Cola
The company rapidly began to grow, quickly surpassing many significant business milestones.
- 1887: The first use of coupons to purchase Coca-Cola
- 1898: Coca-Cola moved to their first independent headquarters, which they quickly outgrew. The company had to move to larger headquarters five times in the next twelve years.
- 1909: The Coca-Cola Bottler magazine begins publication
- 1930: The Coca-Cola Export Corporation was incorporated to help distribute and market the companyís product in international markets
- 1936: Coca-Cola celebrates its 50th anniversary
Fast forward to today, and Coca-Cola is a true giant in the beverage industry. With more than 130 years of serving customers, the company has scaled up to an impressive size. Almost 22,000 Coca-Cola beverages are consumed every second.
Here are a few other statistics on the company’s massive scale:
- Products sold in more than 200 countries
- More than 1.9 billion daily servings of Coca-Cola products
- $44 billion of net operating revenues
- $7.4 billion of net income
- $176 billion market capitalization (as of January 12, 2016)

Source: Coca-Cola Investor Relations
As Coca-Cola has grown, so has their product lineup.
Although Coca-Cola has the third most valuable brand valued at $73 billion in the world according to Interbrand, they own many other products that have been developed internally or through acquisition.
Many people are surprised to learn that many of their favorite drinks are owned by the Coca-Cola company, even if they do not explicitly bear the Coca-Cola name.
Source: Coca-Cola Investor Relations
Coca-Cola now has 20 brands with over $1 billion per year in sales. This diverse product portfolio creates significant operational diversification, and insulates the company from any downturns in interest for any single one of their product.
These 20 $1 billion+ brands are:
- Minute Maid
- Minute Maid Pulpy
- Simply
- Del Valle
- Powerade
- Glaceau Vitamin Water
- Aquarius
- Ayataka
- Coca-Cola
- Fanta
- Sprite
- Diet Coke
- Coca-Cola Zero
- Georgia Coffee
- Schweppes
- I LOHAS
- Dasani
- Bon Aqua
- Gold Peak
- Fuze Tea
Even better, 14 of these 20 brands are stills.
Still drinks (non-carbonated beverages such as water, juices, and teas) have been very popular in recent years because of growing concerns surrounding the health effects of sparkling products (often sugary sodas). The significant potential that exists in Coca-Cola’s portfolio of stills will be discussed in detail later in this article.
Coca-Cola’s broad portfolio of products has given the company a very diversified business model, which has handsomely rewarded investors. The company has generated significant free cash flow that has been returned to investors in a very shareholder-friendly manner.
In the past 5 reported fiscal years, more than $39 billion of capital has been returned to Coca-Cola’s investors through a combination of dividends and share repurchases. A breakdown is shown in the following slide.

Source: Coca-Cola Investor Presentation, slide 48
Coca-Cola is on pace to continue this trend, with an increased dividend in fiscal 2016 and more than $2 billion of share repurchases.
Historical Returns & Sources of Future Growth
Fundamentally, Coca-Cola has done a fantastic job at improving metrics that are commonly associated with business success.
Between 2000 and 2015, the company has grown earnings-per-share from $0.74 to $2.00, which is equivalent to a CAGR of 6.9%.
Looking back even further, Coca-Cola’s EPS in 1985 was $5.51. However, due to a series of stock splits, each shareholder of Coca-Cola stock in 1985 would effectively own 48 shares today. This means that 1985’s EPS measured in today’s number of shares would be $0.11 (which is $5.51 divided by 48). Doing the math, Coca-Cola has compounded EPS at a CAGR of 10.2%, a very high rate of earnings growth.
This growth in the underlying business has translated to phenomenal returns for Coca-Cola’s shareholders. Historically, the company has been a tremendous investment, delivering returns well in excess of the S&P 500 Index.

Source: Yahoo! Finance
Fortunately, Coca-Cola’s growth prospects are robust. The company’s future growth will largely be driven by three factors. The factors are:
- Organic Growth, driven by expansion of the beverage market and Coca-Cola’s stills portfolio
- Business Restructuring (Coca-Cola is divesting of its bottling operations)
- Penetration in International Markets
Each of these growth factors will be discussed in the next sections.
Organic Growth Prospects
With a declining industry backdrop, it might be difficult to identify organic growth prospects for Coca-Cola. However, they certainly exist, and are two-pronged in nature.
The first expected driver of Coca-Cola’s organic growth will be through the increased market penetration of the company’s stills portfolio.
Already, Coca-Cola’s strong set of assets ensures that consumers keep coming back to purchase more products. This is especially true for their sparkling products, but I have no doubt that the company can use their industry expertise to drive growth in stills.

Source: Coca-Cola Investor Presentation, slide 5
Coca-Cola’s stills products will inevitably benefit from the major trend of consumers switching to healthier choices in the food & beverage industry. Of particular concern to Coca-Cola is the transition of consumers due to the dietary concerns surrounding sugary sodas.
Coca-Cola has identified this trend and is working to aggressively accelerate the growth of their stills portfolio through internal innovation, M&A, and global expansion.

Source: Coca-Cola Investor Presentation, slide 30
Coca-Cola’s existing stills portfolio is substantial. 14 products from this group generate more than $1 billion in annual sales.

Source: Coca-Cola Investor Presentation, slide 32
Another driver of sales for Coca-Cola’s stills portfolio is the growth of the overall stills market. Simply put, these non-carbonated beverages are becoming a larger and larger component of the overall beverage market (growing from 16% in 2000 to 36% in 2015).
Coca-Cola will also benefit from having a smaller market share in stills versus sparkling. Because of their lower market share in this category, the company can expect each dollar of advertising for stills products to yield a higher return than advertising money spent on sparkling products. In other words, Coca-Cola’s stills products should experience less diminishing returns than their sparkling counterparts.
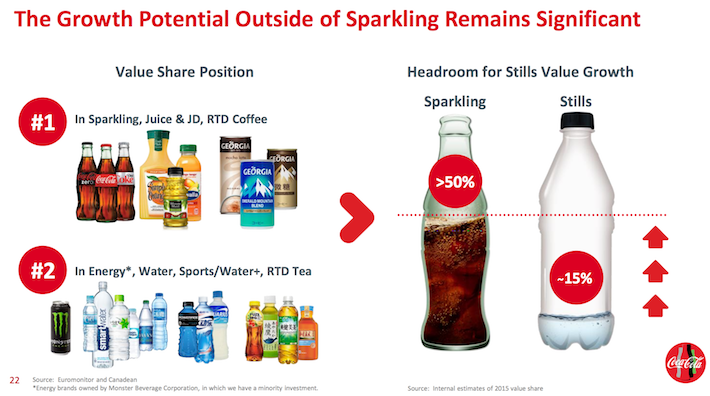
Source: Coca-Cola Investor Presentation, Barclays Global Consumer Staples Conference, slide 22
Combining Coca-Cola’s diversified product portfolio (14 stills brands generating $1 billion+ in revenue) with the rapid growth of the overall stills market and Coca-Cola’s lower market share in stills versus sparkling, and it is almost certain that Coke’s stills segment will be an important part of their growth story moving forward
Quantifying Coca-Cola’s Organic Growth Potential & Market Share
The last section mentioned that Coca-Cola’s organic growth is two-pronged in nature. The second driver of the company’s organic growth will come from the expansion from the overall food & beverage market.
For investors doubting the potential of Coca-Cola’s organic growth, consider the following: Coca-Cola currently has a massive share of the global beverage market. Bloomberg places Coke’s share market share in the soda market at 45% for 2015:

Source: Bloomberg
This incredible market share is very valuable, because consumers do not spend significant amounts of time contemplating which beverage to buy when thirsty.
Rather than exploring all options, consumers will often seek out what is familiar, at least for a small purchase like a bottle of Coca-Cola. This creates ‘stickiness’ in the market share of a company like Coca-Cola.
Because of this stickiness, it is reasonable to assume that Coca-Cola can maintain a relatively stable market share going forward. The company’s revenue growth can be estimated by looking at the growth of the global beverage market as a whole.
In recent years, the worldwide beverage market has grown at a rate slightly above 3.5% per annum.

Source: Statistica
If these levels of growth continue, then even if Coca-Cola simply maintains current market share their revenues will grow at the same pace (3.5%-4.0%).
Taking a different perspective, it was mentioned in the introduction that the global beverage market is expected to grow by $300 billion between 2015 and 2020. This is a growth rate of roughly $60 billion per year, assuming the growth is smooth.
Consider the company’s 45% market share as estimated by Bloomberg. If the company maintains its global market share up to 2020, it will add $27 billionto its market cap each year based on the expected increase in the value of the global beverage market.
Taking into account each of the three years before 2020 (2017, 2018, & 2019), this would result in a $81 billion total increase to Coke’s market capitalization, bringing it from today’s $176 billion to $257 billion. This is good for a CAGR of market capitalization of 13.5%. Investor returns would be even higher than this number because of share buybacks and dividend payments.
However, I believe that a market share of 45% for Coca-Cola might be artificially high. The company’s management has been known to cite a market share of 1/3 in investor presentations. Further, it is important to make conservative estimations when evaluating investments.
If Coca-Cola’s market share is estimated as a much more reasonable 30%, the company’s market capitalization would still rise to $230 billion under these conditions (good for a CAGR of 9.3%).
You can view Coca-Cola’s estimated market capitalization increase and CAGR up to 2020 at different estimated market shares (between 15% and 45%) in the following table.

I can say with a high degree of confidence that Coca-Cola’s actual market share of the global beverage market is somewhere in this range (15%-45%).
Keep in mind that this analysis makes many assumptions that might not be accurate:
- The global beverage market might not grow by as much as $300 billion, or it might actually decline
- Coca-Cola’s actual market share might be below 15% or above 45% (unlikely)
- Coca-Cola’s market share might actually decrease over time
The bottom line is that even under an artificially low assumption about the company’s market cap (15%), the company’s organic growth is still a substantial contributor to shareholder returns (4.9%). If nothing else drove business growth for Coca-Cola, a combination of anticipated market growth and the company’s dividend yield (3.4%) would lead to healthy total returns (8.3%).
However, this is an outsider’s perspective (other than the $300 billion growth assumption, which was actually drawn from Coke’s investor relations page). It is important to compare our own economic analysis to management’s to check for congruence.
Management’s estimations of market share are 1/3 and their expectation for long-term market growth is a CAGR of 5% (very close to our base case market cap CAGR of 4.9%).
This give some clarity as to what to expect as investors.

Source: Coca-Cola Investor Presentation, Barclays Global Consumer Staples Conference, slide 16
The bottom line is that organic growth will be a significant driver of Coca-Cola’s returns moving forward.
Other Drivers of Business Growth: Operational Shifts Away From Bottling
Coca-Cola’s management (or investors, for that matter) are not happy settling for organic growth alone. The company has a clear set of strategic actions to move the needle on shareholder returns.
Coca-Cola’s strategic plan is outlined in the following slide.

Source: Coca-Cola Investor Presentation, slide 6
A key component of this strategy is Coca-Cola’s decision to re-franchise their bottling operations.
For many investors, this is viewed as a reversal of the 2010 decision to take ownership of the company’s independent bottlers (a decision that required a $12.3 billion investment from Coca-Cola).
While that management decision certainly increased the operational size of Coca-Cola, it did not necessarily drive shareholder returns.
The net effect of this new transition is to make Coca-Cola a smaller yet more profitable business. After the divestiture of bottling assets, the company will focus on their core business: the production of syrups and concentrate.

Source: Coca-Cola Investor Presentation, Barclays Global Consumer Staples Conference, slide 11
The company expects that more than 90% of the company’s revenues will come from this side of the business by year-end 2017.
The size of this transformation for Coca-Cola cannot be understated. This change will downsize the company from 123k employees to 39k employees, and reduce the company’s internally-bottled case units from 18% to 3%.
An illustration of the magnitude of Coca-Cola’s business transformation is provided in the following diagram.
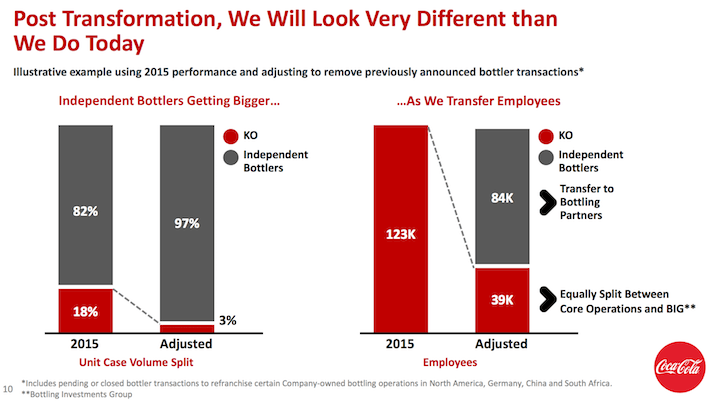
Source: Coca-Cola Investor Presentation, slide 10
Offloading the bottling subsidiaries will significantly reduce Coca-Cola’s revenues. This has been negatively received by some investors.
However, this will be offset by higher gross margins and increased net income for the company. In addition, the company’s bottling operations were noticeably slower at growing revenue than the company’s core business of producing syrup and concentrate.
Year-to-date in fiscal 2016, Coca-Cola’s core business grew revenues by 4% while their Bottling Investments Group (BIG) grew revenues by… 0%.

Source: Coca-Cola Investor Presentation, slide 19
These significant operational changes come at a time when Coca-Cola’s management is also transitioning.
In December, it was announced that Muhtar Kent was stepping down as the CEO of Coca-Cola, effective May 1, 2017. Mr. Kent has been Coca-Cola’s CEO since 2008 and his tenure has received mixed reviews from investors (particularly in recent years).
Around the same time, we found out that Howard Buffett (son of Warren Buffett, one of Coca-Cola’s largest shareholders via Berkshire Hathaway) was resigning from the Board of Directors.
Kent’s successor is James Quincey, the current President and Chief Operating Officer. As someone with an extensive knowledge of the company’s operational complexities, he is well-poised to oversee the offloading of Coca-Cola’s bottling operations.
All things considered, this organizational change should leave Coca-Cola well-positioned to focus on their core business, resulting in improved company results.
Identifying Growth in Developing Markets
Coca-Cola’s third strategy for growth has been focusing on penetrating more developing markets.
This is prudent because international countries are expected to take more and more of the global beverage market share over the next few years. By focusing on the fastest-growing markets, Coca-Cola should drive sales, improving investor returns.
The following diagram outlines the forecasted market share by geography for the beverage market in 2021.

Source: Beverage Daily
Currently, Coca-Cola’s operations are diversified into the following segments:
- Eurasia & Africa Operating Group (16% of 2015 unit case volume)
- Europe Operating Group (13% of 2015 unit case volume)
- Latin America Operating Group (29% of 2015 unit case volume)
- North American Operating Group (20% of 2015 unit case volume)
- Asia Pacific Operating Group (22% of 2015 unit case volume)
While the company’s operations are currently well-diversified, expect Coca-Cola’s Asia Pacific Operating Group to experience rapid growth in the next few years.
Looking at The Numbers
As was mentioned in the introduction to this article, fiscal 2015 saw many investors become bearish on Coca-Cola as the company saw revenues drop 4% and operating profits decrease by 10%. The company’s recent financial performance is summarized below.
Though the company has only reported the first three quarter so far, fiscal 2016 is off to a much better start than 2015. Profits are up 7% on a YTD basis.

Source: Coca-Cola Third Quarter Earnings Presentation, slide 4
Please note that the ‘profit’ that the company is citing is actually comparable currency neural income before taxes (which is a non-GAAP measurement).
The company also saw the organic revenues of its core business rise by 4% on a YTD basis.
The third quarter’s strong results allowed management to reassert the full-year outlook for fiscal 2016.

Source: Coca-Cola Third Quarter Earnings Presentation, slide 16
While outlook remains generally unchanged except with regard to capital expenditures, there is one item of note for the Coca-Cola investor.
The effects of currency fluctuations on the company’s globalized business model continues to be a problem. Currency is expected to detract 6% to 7% from the company’s fiscal 2016 revenues, which is a very substantial number. The effect of currency on Coca-Cola’s earnings is expected to be even more severe, reducing the company’s profits by 8% to 9%.
However, this will not be an ongoing trend. The US dollar is trading at elevated levels right now. When the greenback eventually returns to a more normalized price, this will provide a significant tailwind for Coca-Cola’s earnings.
Otherwise, it appears to be business as usual at the world’s largest beverage company. They are expecting 6% to 8% non-GAAP income before tax growth, which is a healthy number. Coca-Cola continues to repurchase shares at a rapid rate, buying back $2.0-$2.5 billion in company stock during fiscal 2016.
Final Thoughts
While not the most exciting company in the world, Coca-Cola’s success has made the company a long-time favorite of The 8 Rules of Dividend Investing.
Sure Dividend’s ranking system is not the only system that finds Coca-Cola attractive; this company is also the most owned dividend growth stock among dividend growth bloggers, and one of Warren Buffett’s top 20 high dividend stocks.
With an industry-leading market share and strong growth prospects due to business restructuring and growth in the worldwide beverage market, Coca-Cola is a foundational stock for dividend growth investor’s portfolios.
Disclosure:
Sure Dividend is published as an information service. It includes opinions as to buying, selling and holding various stocks and other securities.
However, the publishers ...
more

