
Citigroup Chart Is A Cut Above All Other Banks
Once interest rates started coming down in early July, the bank sector was punished. The exception is Citigroup. Its chart is in far better shape than the other big banking names, like JP Morgan, Bank of America and Wells Fargo.
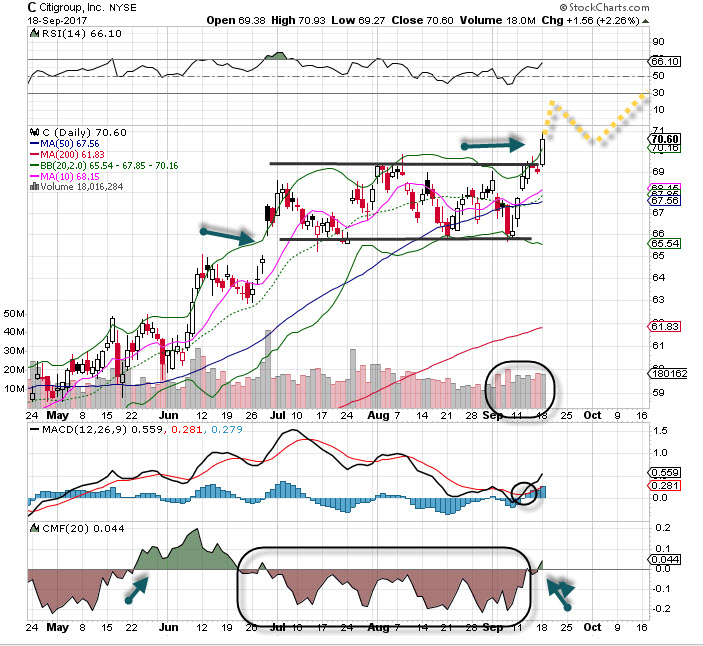
Monday’s action was particularly notable with a strong breakout from a range on decent volume. In fact, Citi hit a new multi-year high on Monday, and with some follow through we are likely to see even higher prices.
Indicators are looking good as well. The MACD turned up and confirmed a solid buy signal. The lower end of the range (in the mid-60's) held firm, as did the gap from June. The gap will eventually close, but for right now that support is meaningful. Money flow just turned positive again, and while the RSI is nearly overbought, we expect to see the stock follow the path of the yellow line, perhaps moving up some 15% (or more) by year’s end.
Disclosure: None.


