
Broadcom LTD Moves Into First Place On Our Nasdaq Top-Ten List
Rating and Ranking the Nasdaq
We use our data to track individual stocks, industries, sectors, and indices. For today's bulletin, we present key metrics for the top picks in the Nasdaq 100. The companies listed below represent the top-ten BUY and STRONG BUY stocks within the index. They are presented below according to their one-month forecast target prices.
We have two new companies on our list since the last time we presented the top Nasdaq picks at the beginning of April. Applied Materials (AMAT) and NVidia (NVDA) are new--they replaced MSFT and AMGN. LAM Research (LRCX), NetEase (NTES), Gilead (GILD), Cisco (CSCO), and Intel (INTC) have declined. Citrix (CTXS) has moved into the top-five and Broadcom (BRCM) is our new #1 S&P 500 stock.
|
Ticker |
Company Name |
Market Price |
Valuation |
Last 12-M Retrn |
1-M Forecast Retn |
1-Yr Forecast Retn |
P/E Ratio |
Sector |
4-7-2016 Leaders |
|
AVGO |
BROADCOM LTD |
151.53 |
-0.87% |
26.12% |
0.93% |
11.18% |
17.63 |
Computer and Technology |
LRCX |
|
LRCX |
LAM RESEARCH |
80.97 |
-10.11% |
6.08% |
0.91% |
10.93% |
13.34 |
Computer and Technology |
NTES |
|
NTES |
NETEASE INC |
133.14 |
-12.91% |
8.02% |
0.84% |
10.08% |
15.11 |
Computer and Technology |
GILD |
|
GILD |
GILEAD SCIENCES |
100.72 |
-6.73% |
-2.16% |
0.83% |
9.96% |
8.00 |
Medical |
AVGO |
|
CTXS |
CITRIX SYS INC |
83.9 |
5.80% |
25.32% |
0.76% |
9.13% |
20.07 |
Computer and Technology |
CSCO |
|
AMAT |
APPLD MATLS INC |
21.42 |
-1.01% |
7.26% |
0.59% |
7.13% |
18.00 |
Computer and Technology |
INTC |
|
NVDA |
NVIDIA CORP |
37.31 |
46.80% |
68.06% |
0.58% |
6.95% |
28.77 |
Computer and Technology |
CTXS |
|
CSCO |
CISCO SYSTEMS |
28.64 |
0.80% |
-0.87% |
0.57% |
6.85% |
13.75 |
Computer and Technology |
MSFT |
|
ATVI |
ACTIVISION BLZD |
34.37 |
8.05% |
44.90% |
0.54% |
6.50% |
28.64 |
Consumer Discretionary |
AMGN |
|
INTC |
INTEL CORP |
31.75 |
6.47% |
-2.31% |
0.54% |
6.47% |
12.85 |
Computer and Technology |
ATVI |
NOTE: New stocks are in BOLD.
Below is today's data on Applied Materials (AMAT):
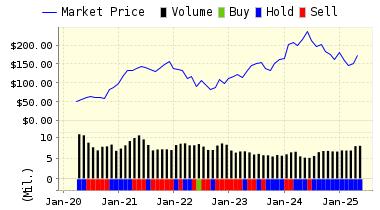
Applied Materials develops, manufactures, markets and services semiconductor wafer fabrication equipment and related spare parts for the worldwide semiconductor industry. Customers for these products include semiconductor wafer manufacturers and semiconductor integrated circuit manufacturers, who either use the Ics they manufacture in their own products or sell them to other companies. These ICs are the key components in most advanced electronic products such as computers, telecommunications devices, automotive engine management systems and electronic games.
VALUENGINE RECOMMENDATION: ValuEngine continues its BUY recommendation on APPLD MATLS INC for 2016-04-27. Based on the information we have gathered and our resulting research, we feel that APPLD MATLS INC has the probability to OUTPERFORM average market performance for the next year. The company exhibits ATTRACTIVE Company Size and Momentum.
You can download a free copy of detailed report on AMAT from the link below.
|
ValuEngine Forecast |
||
|
Target |
Expected |
|
|---|---|---|
|
1-Month |
21.55 | 0.59% |
|
3-Month |
21.63 | 0.98% |
|
6-Month |
21.82 | 1.88% |
|
1-Year |
22.95 | 7.13% |
|
2-Year |
22.58 | 5.40% |
|
3-Year |
21.09 | -1.56% |
|
Valuation & Rankings |
|||
|
Valuation |
1.01% undervalued |
Valuation Rank(?) |
|
|
1-M Forecast Return |
0.59% |
1-M Forecast Return Rank |
|
|
12-M Return |
7.26% |
Momentum Rank(?) |
|
|
Sharpe Ratio |
0.21 |
Sharpe Ratio Rank(?) |
|
|
5-Y Avg Annual Return |
6.09% |
5-Y Avg Annual Rtn Rank |
|
|
Volatility |
29.04% |
Volatility Rank(?) |
|
|
Expected EPS Growth |
28.57% |
EPS Growth Rank(?) |
|
|
Market Cap (billions) |
26.32 |
Size Rank |
|
|
Trailing P/E Ratio |
18.00 |
Trailing P/E Rank(?) |
|
|
Forward P/E Ratio |
14.00 |
Forward P/E Ratio Rank |
|
|
PEG Ratio |
0.63 |
PEG Ratio Rank |
|
|
Price/Sales |
2.75 |
Price/Sales Rank(?) |
|
|
Market/Book |
8.35 |
Market/Book Rank(?) |
|
|
Beta |
1.76 |
Beta Rank |
|
|
Alpha |
-0.06 |
Alpha Rank |
|
ValuEngine Market Overview
|
Summary of VE Stock Universe |
|
|
Stocks Undervalued |
50.58% |
|
Stocks Overvalued |
49.42% |
|
Stocks Undervalued by 20% |
21.17% |
|
Stocks Overvalued by 20% |
17.01% |
ValuEngine Sector Overview
|
Sector |
Change |
MTD |
YTD |
Valuation |
Last 12-MReturn |
P/E Ratio |
|
0.81% |
11.31% |
32.75% |
21.32% overvalued |
7.02% |
26.69 |
|
|
0.08% |
1.04% |
5.33% |
11.04% overvalued |
-2.29% |
23.94 |
|
|
0.38% |
2.56% |
7.31% |
10.63% overvalued |
-8.14% |
17.83 |
|
|
1.90% |
13.73% |
13.11% |
10.05% overvalued |
-34.06% |
24.18 |
|
|
-0.20% |
5.12% |
9.26% |
9.74% overvalued |
-10.67% |
20.02 |
|
|
0.50% |
0.30% |
7.31% |
8.08% overvalued |
-3.92% |
23.16 |
|
|
0.20% |
1.66% |
7.77% |
2.95% overvalued |
-10.94% |
22.34 |
|
|
0.72% |
4.37% |
0.93% |
2.02% overvalued |
-5.42% |
20.95 |
|
|
0.47% |
4.67% |
19.96% |
0.55% overvalued |
-4.67% |
21.61 |
|
|
0.37% |
2.06% |
7.46% |
0.36% overvalued |
-8.58% |
27.35 |
|
|
0.09% |
3.57% |
1.76% |
0.43% undervalued |
-5.89% |
15.99 |
|
|
-0.28% |
2.02% |
4.20% |
3.11% undervalued |
-9.38% |
25.24 |
|
|
-0.10% |
1.47% |
1.79% |
4.19% undervalued |
-15.10% |
22.73 |
|
|
0.01% |
2.05% |
3.83% |
4.80% undervalued |
-14.59% |
12.58 |
|
|
0.59% |
5.22% |
6.14% |
6.44% undervalued |
-27.02% |
13.85 |
|
|
-0.20% |
6.69% |
-1.74% |
7.32% undervalued |
-18.89% |
27.04 |
Disclosure: None.
Disclaimer: ValuEngine.com is an independent research provider, producing buy/hold/sell recommendations, ...
more

