
Breakout Imminent In Pure Growth And High Beta Indexes
I watch closely a set of price ratios between different types of stocks when I analyze the US stock market. Such relative performance analysis is a good indicator of market confidence/sentiment or risk-on/risk-off environment. Generally, it is bullish for the broad market when small-caps are doing better than large-caps, growth stocks are outperforming value stocks, and offensive sectors are leading the market while defensive sectors are lagging. It indicates market participants are confident and optimistic about the economic outlook and future corporate profits, and are willing to invest in more aggressive or speculative (riskier, more volatile) stocks.
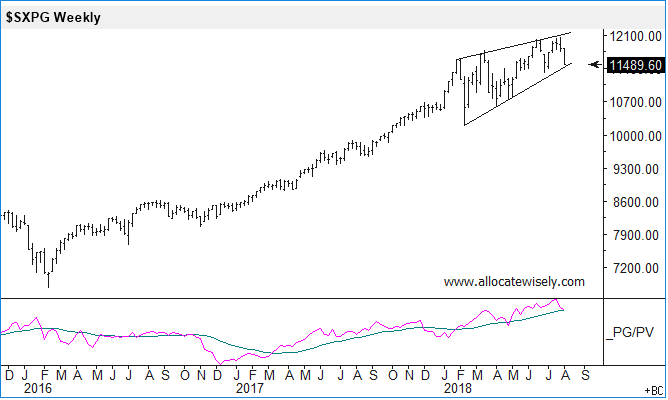
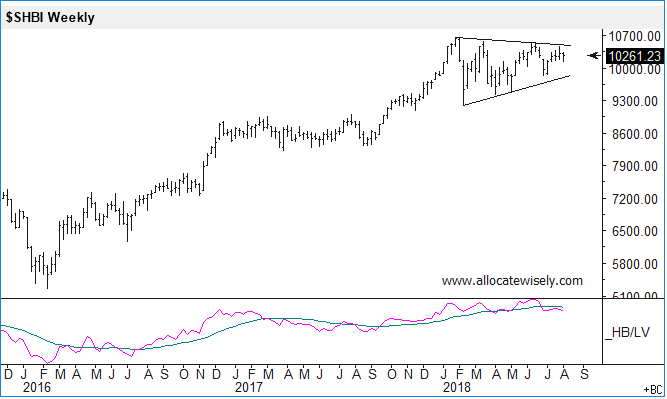
The S&P 500 Pure Growth Index vs. the S&P 500 Pure Value Index and the S&P 500 High Beta Index vs. the S&P 500 Low Volatility Index are two of my favorite price ratios since these indexes do not have overlaps. First chart below shows the Pure Growth Index performance and its performance vs. the Pure Value Index. Pure Growth has been doing better than Pure Value from early 2017. Second chart shows the High Beta Index performance and its performance vs. the Low Volatility Index. The High Beta Index and the ratio line have been going mostly sideways this year. Both the Pure Growth Index and the High Beta Index are showing triangle patterns (contracting volatility) so we should expect some type of breakout (expanding volatility) in either direction coming soon.
Disclosure: The analysis provided here is usually part of the analysis the author uses when he is designing and managing his investment portfolios.
Disclaimer: The analysis presented ...
more

