
Bitcoin, Meet Tilray (TLRY)
As mentioned in a post earlier, shares of cannabis drug maker Tilray (TLRY) have gone absolutely bananas in the short time it has been public. In the 47 trading days since its IPO, the stock is already up over 1,200%. In order to help put the stock’s surge in perspective, we wanted to compare its recent performance to the performance of bitcoin during its monster surge in 2017. For starters, consider this: during all of 2017, bitcoin rallied just over 1,400%. TLRY has done nearly that in two months!
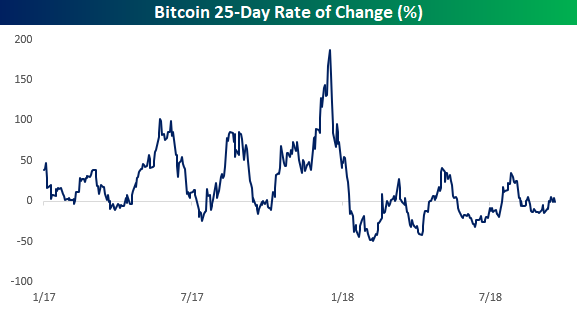
The chart below shows the 25-trading day rolling performance of bitcoin throughout 2017 and into 2018. For practically all of 2017, bitcoin’s rolling return remained positive and when it went into negative territory, it rarely dipped very low or stayed there long. On the upside, though, there were multiple periods where the rolling 25-day return topped 100%, and at the height of the mania in late 2017, bitcoin actually rallied close to 200% in just five weeks! Pretty impressive, right?
The chart below is the same one as above, except we have adjusted the y-axis to include the level that corresponds to TLRY’s current five-week return of +691%. Suddenly, bitcoin’s move doesn’t look quite as impressive, does it? In fact, at the peak of the bitcoin mania in 2017, its trailing 25-day return peaked out at 187%. That’s less than a third of TLRY’s gain over the last five weeks. Granted, bitcoin managed to post strong returns for a much longer period than TLRY has so far. In terms of the magnitude of short-term moves, however, bitcoin doesn’t hold a candle to TLRY.

Disclaimer: To begin receiving both our technical and fundamental analysis of the natural gas market on a daily basis, and view our various models breaking down weather by natural gas demand ...
more

