
5 Potential Breakout Stock Charts
With just a few more days before the final trading session of 2013, it would take a pretty active couple of days to derail what's been a spectacular year for stock investors. Since the calendar flipped over to January, the S&P 500 (SPX) (SPY) has rallied more than 29%, climbing to new all-time highs in spite of a real lack of participation in among retail investors. And if last week's trading is any indication, a Santa Claus rally looks likely to tack on some extra gains before the first trade of 2014. That's why we're taking a closer technical look at five year-end trades to take this week.
If you're new to technical analysis, here's the executive summary:
Technicals are a study of the market itself. Since the market is ultimately the only mechanism that determines a stock's price, technical analysis is a valuable tool even in the roughest of trading conditions. Technical charts are used every day by proprietary trading floors, Wall Street's biggest financial firms, and individual investors to get an edge on the market. And research shows that skilled technical traders can gain an edge over the short-term market moves.
Here are five high-volume stocks on the radar:
Bally Technologies (BYI)
It may seem like a sort of unlikely choice, but mid-cap gambling device designer Bally Technologies(BYI) is topping off our list today. Bally is capping off a stellar run in 2013, after rallying more than 72% since the start of the year. But don't worry if you missed the move; the technicals point to even higher ground in the short-term.
BYI Daily Chart
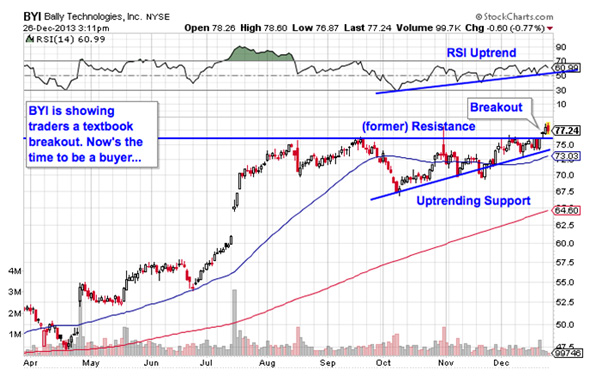
That's because Bally is currently forming an ascending triangle pattern, a bullish price setup that's formed by a horizontal resistance level above shares and uptrending support to the downside. Basically, as BYI bounced between those two technical price levels, it's been getting squeezed closer and closer to a breakout above resistance. The breakout happened just before Christmas, and it's giving us a buy signal this week.
Momentum adds some extra confidence to the setup in BYI: 14-day RSI has been trending higher since early October, an indication that buyers have been piling in at an increasing rate as the pattern developed. If you decide to jump in here, I'd recommend putting a protective stop at the 50-day moving average.
Stericycle (SRCL)
We're seeing the exact same setup in shares of Stericycle (SRCL), but with one big difference: This stock hasn't broken out yet. Stericycle is another ascending triangle pattern, in this case with a resistance level at $120. A breakout above that $120 price ceiling is the signal that it's time to take this trade.
SRCL Daily Chart

Whenever you're looking at any technical price pattern, it's critical to think in terms of buyers and sellers. Triangles and other pattern names are a good quick way to explain what's going on in a stock, but they're not the reason it's tradable – instead, it all comes down to supply and demand for shares.
That $120 resistance level is a price where there has been an excess of supply of shares; in other words, it's a place where sellers have been more eager to step in and take gains than buyers have been to buy. That's what makes a breakout above it so significant — the move means that buyers are finally strong enough to absorb all of the excess supply above that price level.
Don't be early on the SRCL trade.
Ansys (ANSS)
$8 billion engineering simulation software maker Ansys (ANSS) is looking tradable too after spending most of the last five months in a sideways slump. Even though ANSS' price action hasn't exactly shown outstanding momentum, the bias is definitely on the side of sellers right now.
ANSS Daily Chart
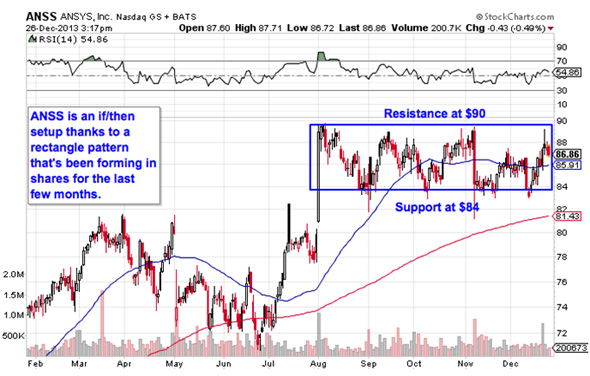
Ansys is currently forming a rectangle pattern, a consolidation setup that's formed by a pair of horizontal price levels that basically "box in" shares of the stock. In Ansys, the rectangle is formed by resistance above shares at $90 and support down at $84. The breakout signal works just like the ones in BYI and SRCL – a move through the $90 level is the buy signal for shares of Ansys.
Strictly speaking, a move through $84 support is just as strong of a sell signal as the move through $90 is to buy. But the moves leading up to the rectangle pattern have a lot to say about how these setups typically resolve. Since ANSS started consolidating after a move up, a bullish breakout is the likelier outcome here. Either way, don't try to predict what's going to happen in shares; just be ready to react to it.
Apple (AAPL)
I've been a big fan of Apple (AAPL) for while now — I own shares too. I'm happy to report that, from a technical standpoint, Apple couldn't look much better than it does now. And you don't have to be some kind of expert technical analyst to see why.
AAPL Daily Chart
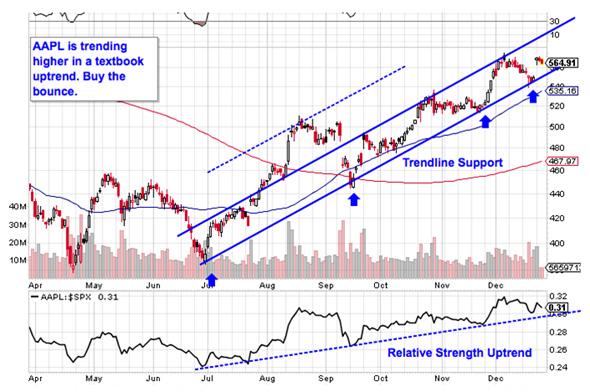
Apple is currently forming an uptrending channel, a setup formed by a pair of parallel trendlines. When it comes to price channels, up is good and down is bad; it's as simple as that. Shares have bounced higher on each of the last four tests of trendline support, and so, with the most recent bounce just a couple sessions ago, now's a pretty good time to be a buyer once again.
Relative strength (not to be confused with RSI, the momentum gauge we looked at earlier) continues to look exemplary for Apple right now. With a market that's teetering on new highs as I write, relative strength remains the single most important technical indicator to add to your toolbox right now. It speaks volumes that Apple's RS line is still in bull mode.
The 50-day moving average has been a pretty good proxy for support for the last few months, so short-term traders may want to consider putting a protective stop just below it.
Honeywell (HON)
Last up is Honeywell (HON), another basic channel trade to watch right now.
HON Daily Chart
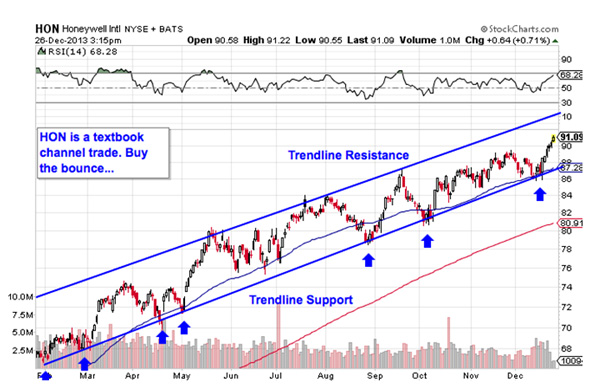
Honeywell has been forming a picture-perfect uptrending channel since back in February, bouncing higher off of each of the last seven tests of support. More bounces indicate more buying pressure below the trendline, and that's a very good thing for anyone who owns HON right now.
While shares of Honeywell are a fair bit off of trendline support right now, it still makes sense to wait for the next return to the lower bound of the channel. Then, buy the bounce.
Buying off a support bounce makes sense for two big reasons: it's the spot where shares have the furthest to move up before they hit resistance, and it's the spot where the risk is the least (because shares have the least room to move lower before you know you're wrong). Remember, all trend lines do eventually break, but by actually waiting for the bounce to happen first, we're ensuring HON can actually still catch a bid along that line.
Courtesy of Jonas Elmerraji, Stockpickr


