
2018 – The Lurking Bear
Before the year ends, I wanted to take a brief look back at the last six month, but more importantly, at the year ahead that awaits us. In my last market update, from June 23 of this year, we discussed the continuing bull market in SPX and how it was following nicely the 10 year crude oil analog. We forecast continued strength in SPX, as a period of sideways consolidation was likely to breakout to new highs before year end. SPX closed on 6/23 at 2438, and currently trades at 2675. Voila! The crude oil analog in practice.
So what awaits us in 2018? As you know, 2008 was a wild year for crude oil. The chart below shows the price of crude oil from 2007-2008. The first half of 2008, saw the final rising wedge formation for crude, followed by a powerful collapse during the second half of the year. My contention is that QE from the ECB/BOJ combined with other market forces is pulling this analog slightly ahead. I believe we currently find ourselves where the red arrow is showing below.
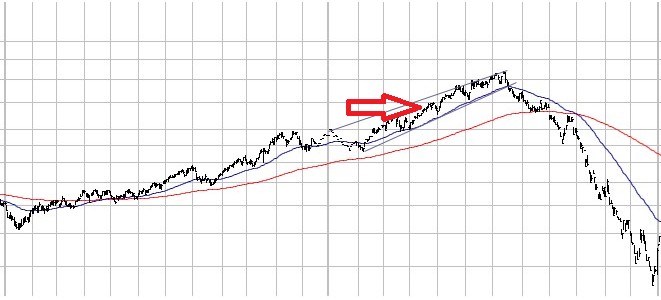
Evidence of this can be seen in the below chart of SPX. If you notice the multi-month sideways consolidation that happened in crude oil during the last two months of 2007,and the first two months of 2008.
The same consolidation happened in SPX this year, during the March-September time frame, but with a slightly up trending consolidation channel, instead of sideways. This can be an indication of market forces pulling the analog forward slightly. It can also be an indication that where the crude oil chart ended with a rising wedge, SPX in 2017-2018 may end with a parabolic rise.

As we enter 2018, the areas that I will be watching to determine when to switch from a bullish to bearish trading stance will be:
- When does SPX break below the 50 day moving average?
- CL analog adjusted timescale looking for March/April top?
- CL analog looking for SPX top between 2850-3000?
- ATR based reversal signals.
If you look at the final rising wedge in the crude oil chart, you will notice that it never breaks below the 50 day moving average until the bear market began. A similar scenario could play out with SPX in 2018, and will be one key indicator to watch.
If market forces are indeed pulling forward the crude oil analog, I’m currently looking for a top in the March/April 2018 time frame, between SPX 2850-3000. The crude oil market topped in July of 2008.
As always, follow the trend. The market we are currently in is pristine for ATR based trading. We are seeing long lasting, powerful uptrends. And we will likely see a fast paced, continuous downtrend at some point in 2018. There is no need to guess, in my opinion.The trend will tell you when it reverses. I suggest following it.
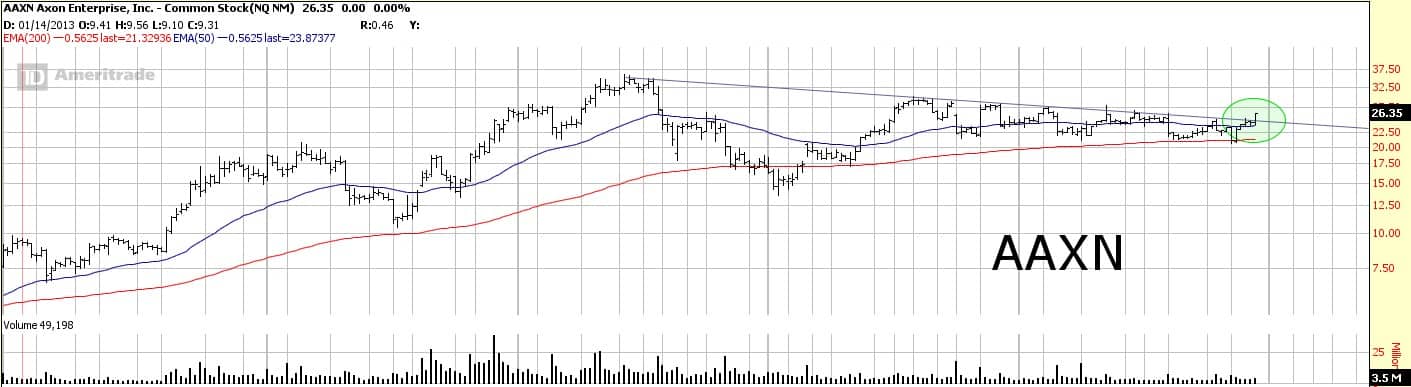
Finally, I will leave you with an update on Axon. Since its high in June of 2015, AAXN has been undergoing a consolidation. It is worth taking note of the possible breakout AAXN saw this week from the consolidation. A worthy addition here to a long term hold portfolio.
Disclaimer: This is not meant to be a recommendation to buy or to sell securities nor an offer to buy or sell securities. Before selling or buying any stock or other investment you should consult ...
more

