
Realty Income Corp - Chart Of The Day
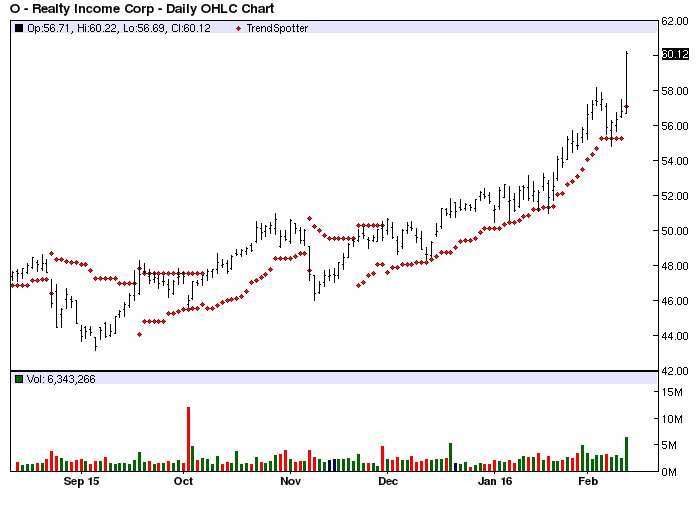
The Chart of the Day belongs to Realty Income Corp (NYSE:O). I found the retail REIT by using Barchart to sort the All Time High list first for the highest technical buy signals, then I used the Flipchart feature to review the charts. Since the Trend Spotter signaled a buy on 11/20 the stock gained 21.04%.
Realty Income Corp is a fully integrated, self-administered and self-managed real estate company with in-house acquisition, leasing, legal, financial underwriting, portfolio management and capital markets expertise.
The status of Barchart's Opinion trading systems are listed below. Please note that the Barchart Opinion indicators are updated live during the session every 10 minutes and can therefore change during the day as the market fluctuates. The indicator numbers shown below therefore may not match what you see live on the Barchart.com web site when you read this report.
Barchart technical indicators:
- 100% technical buy signals
- Trend Spotter buy signal
- Above its 20, 50 and 100 day moving averages
- 13 new highs and up 15.02% in the last month
- Relative Strength Index 76.48%
- Technical support level at 55.90
- Recently traded at 60.12 with a 50 day moving average of 52.64
Fundamental factors:
- Market Cap $15.01 billion
- P/E 20.80
- Dividend yield 4.23%
- Revenue expected to grow 9.30% this year and another 7.30% next year
- Earnings estimated to increase 6.20% this year, an additional 4.00% next year and continue to increase at an annual rate of 4.53% for the next 5 years
- Wall Street analysts issued 5 strong buy, 10 hold and 1 sell recommendation on the stock
This is not a trading stock and should be held as long as revenue and earnings projections forecast support the dividend.
Disclosure: None.


