
EUR/USD Support Bounce, USD Drops Ahead Of Pivotal ECB Meeting
Next week brings a pivotal ECB rate decision on Thursday. This is the last rate decision before the bank’s December meeting in which the current stimulus program is set to expire, and the large expectation for next Thursday is that we’ll see the European Central Bank ‘recalibrate’ their stimulus program. In latter September, the ECB’s Chief Economist said that the bank would not look at a full-scale stimulus exit, instead electing to recalibrate current measures. The expectation around that is that we’ll see a smaller monthly amount of purchases beyond the current expiration of December 2017. The big question there is by how much and for how long?
For its part, EUR/USD has remained relatively bullish on longer-term charts, continuing to find support around a key zone. Near-term price action put in a bearish move in latter-September as we opened into Q4, and for much of October the pair has seen some type of sideways price action. But the longer-term zone of support that runs from 1.1685-1.1736 remains after multiple tests over the past three months. To put into scope how relatively minor this retracement has been, we’re looking at the 2017 bullish trend on the below chart, and notice how we had only retraced a mere 23.6% of this year’s bullish move.
EUR/USD Daily: 23.6% Retracement of the 2017 Bullish Trend
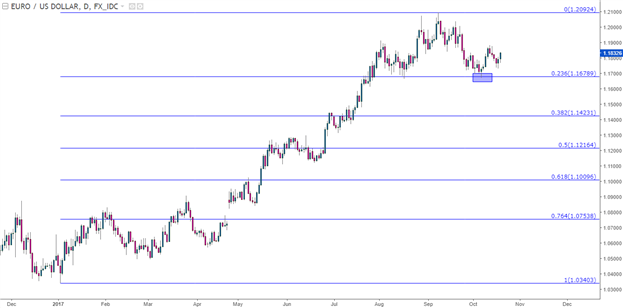
Chart prepared by James Stanley
It’s the longer-term connotations around that area of support that are perhaps more interesting. At 1.1685 we have the 23.6% retracement of the 2008-2017 major move; and at 1.1736 we have the 38.2% retracement of the ECB QE move, taking the 2014 high down to the 2017 low. Collectively these prices produce a zone of support that’s helped to elicit buyers into the pair since mid-August.
EUR/USD Daily: 2017 Bullish Trend Remains Supported at Longer-Term Zone
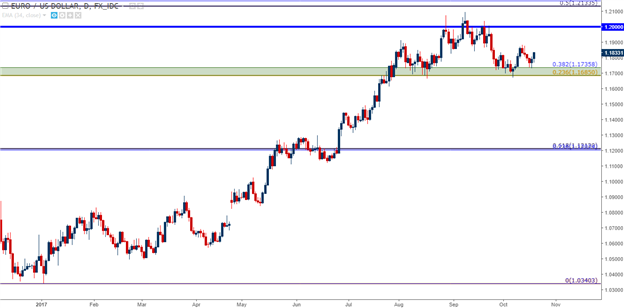
Chart prepared by James Stanley
On shorter-term charts, we have the prospect of a recent higher-low indicating the potential return of the longer-term bullish trend. Earlier in October, we saw a test of the bottom side of the zone; but as NFP came in at -33k, another round of USD weakness developed and buyers pushed the pair higher. On a subsequent re-approach towards support earlier this week – buyers stepped in at the top-side of the zone, offering a higher-low on the hourly chart. If this can be accompanied by a near-term higher-high, as denoted by a topside break of the prior swing at 1.1880, the door is opened for bullish continuation as we move towards ECB. Targets can be investigated at prior levels of resistance; around 1.2000, and then around 1.2050. If we do get a topside break of the 2017 high, additional targets can look towards 1.2134 (Fibonacci level) and then 1.2250 (psychological level).
EUR/USD Hourly: Near-Term Trend-line Resistance, Higher Low after Recent Higher-High
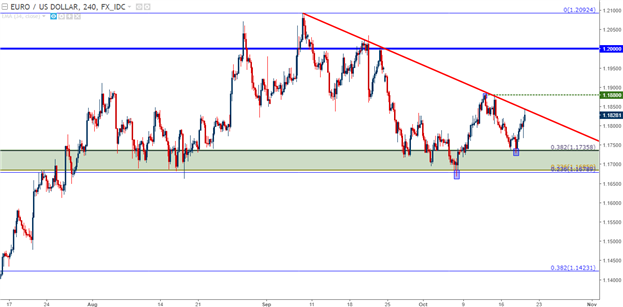
Chart prepared by James Stanley
USD Falls Back
Yesterday we looked at the continued strength in the Greenback after last week’s CPI report. We pointed out a key area of resistance that would likely soon be tested; and sellers have come-in ahead of that level, giving the appearance of bearish continuation in the Greenback.
But as we warned yesterday – that theme of continued USD weakness is not without hindrance, as a short-heavy market remains vulnerable to short-squeeze scenarios, particularly in a currency backed by a Central Bank that appears headstrong around a December rate hike. Rather than chasing the Dollar around while near-term price action remains relatively messy, traders can look for the prior swing-low of 92.75 to be taken out, which was set during last week’s CPI announcement, before plotting bearish continuation scenarios in USD. On the chart below, we’re looking at the relevancy of this level along with a key area of longer-term confluent support that helped to print the prior September low.
U.S. Dollar via ‘DXY’ Four-Hour: Turns Lower Ahead of Big Picture Resistance
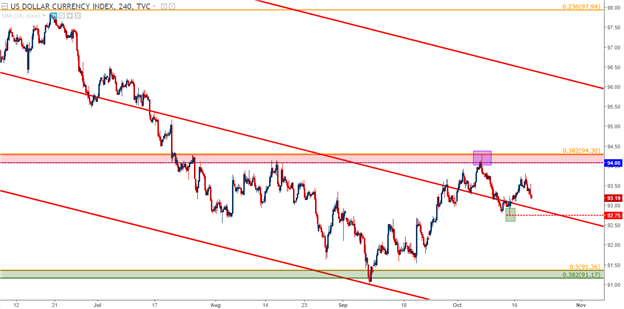
Chart prepared by James Stanley
While near-term price action in the U.S. Dollar is a little messy, the British Pound is another story altogether. The combined forces of dovish long-term expectations to go along with hawkish short-term expectations have produced a quagmire in short-term price action in the British Pound.
After the BoE warned that rate hikes may be on the horizon in September, GBP/USD burst up to a fresh yearly high as traders tried to get in front of any potential rate hikes. But in the days following, as Mr. Mark Carney tempered that excitement, prices pulled lower as a bull flag formation developed. That that bull flag did not hold for long, as a bearish break developed with price action making a run towards the 1.3000 psychological level.
But that same NFP report that helped to set a low in EUR/USD helped to set a low in Cable, as well; and buyers stepped in about 25 pips above the vaulted 1.3000 level to launch prices higher. But that bullish run would be short lived, as well, as resistance came in at 1.3320 and price action moved right back down to a key zone of longer-term support that runs from 1.3117-1.3187. At this stage, it can be difficult to surmise a longer-term direction in the pair, as we see below.
GBP/USD Weekly: Longer-Term Wedge, More Recent Bullish Channel
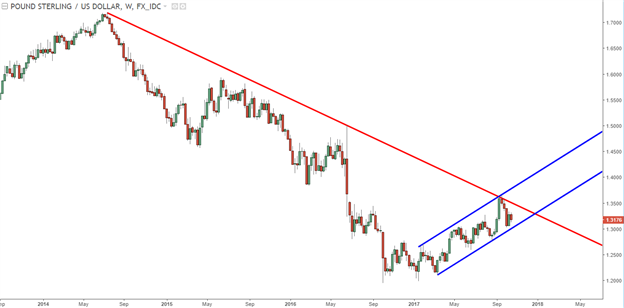
Chart prepared by James Stanley
Near-term price action is not much clearer. The bullish run in mid-September appeared to have legs. But as Mr. Carney began to send dovish signals to markets, that bullish theme unraveled. And then as Brexit discussions became even-murkier, with the legitimate prospect of a no-deal Brexit scenario, further selling drove prices below the 61.8% retracement of that recent bullish move.
As USD-weakness came-back after NFP earlier in October, GBP/USD rallied up to the 38.2% retracement of that move, at which point sellers took over, again, to spurn the upward advance. At this stage we’re seeing near-term resistance come-in off the 50% retracement of that recent bullish move.
GBP/USD Four-Hour: Prior Bullish Move Unraveled, Resistance at 50% Retracement of that Move
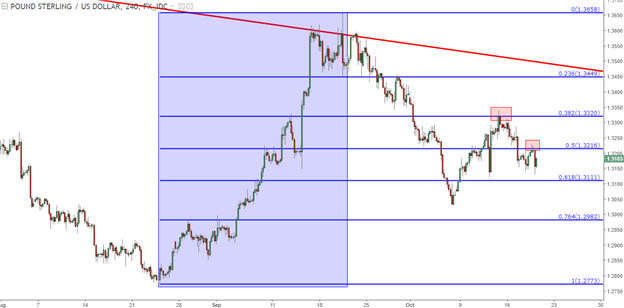
Chart prepared by James Stanley
We looked into GBP/USD in yesterday’s technical article entitled, GBP/USD Technical Analysis: Clinging to Long-Term Support Zone. The levels that we’re referring to for that support zone consist of 1.3187, as the 23.6% retracement of the 2014-2016 major move; and 1.3117 as the 38.2% retracement of the ‘Breixt move’, taking the June 2016 high down to the December low. While this zone hasn’t been as supportive as the one we looked at above in EUR/USD, markets continue to price Cable around this area on the chart.
Rather than playing in between the cracks, we looked at two areas that can be used to demarcate a directional move in the pair. A top-side break above near-term resistance at 1.3350 can be used to open the door to bullish approaches while a down-side break below 1.3000 can open the door for bearish themes in the pair.
GBP/USD Four-Hour: Directionless Near-Term, Let Price Action Pick a Direction Before Chasing
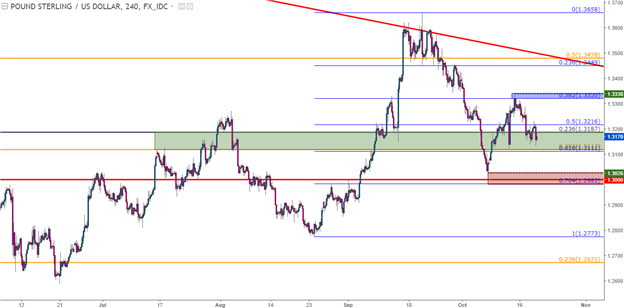
Chart prepared by James Stanley


