
Michigan Consumer Sentiment: September Sees Robust Rise
The University of Michigan Preliminary Consumer Sentiment for September came in at 100.8, up 4.6 from the August Final reading. Investing.com had forecast 96.7.
Surveys of Consumers chief economist, Richard Curtin, makes the following comments:
Consumer sentiment posted a robust rise in early September, reaching 100.8, the second highest level since 2004-only behind the March 2018 reading of 101.4. Importantly, the gains were widespread across all major socioeconomic subgroups. The Expectations Index reached its highest level since July 2004, largely due to more favorable prospects for jobs and incomes (see the chart). Despite a lessening of expected gains in nominal incomes in September, inflation expectations also declined, acting to offset concerns about declining living standards. Consumers anticipated continued growth in the economy that would produce more jobs and an even lower unemployment rate during the year ahead. While consumers were somewhat more likely to anticipate that the economic expansion would continue uninterrupted over the next five years, nearly as many expected another downturn sometime in the next five years. The largest problem cited on the economic horizon involved the anticipated negative impact from tariffs. Concerns about the negative impact of tariffs on the domestic economy were spontaneously mentioned by nearly one-third of all consumers in the past three months, up from one-in-five in the prior four months. [More...]
See the chart below for a long-term perspective on this widely watched indicator. Recessions and real GDP are included to help us evaluate the correlation between the Michigan Consumer Sentiment Index and the broader economy.

To put today's report into the larger historical context since its beginning in 1978, consumer sentiment is 17.2 percent above the average reading (arithmetic mean) and 18.6 percent above the geometric mean. The current index level is at the 91st percentile of the 489 monthly data points in this series.
Note that this indicator is somewhat volatile, with a 3.0 point absolute average monthly change. The latest data point saw a 4.8 percent change from the previous month. For a visual sense of the volatility, here is a chart with the monthly data and a three-month moving average.

For the sake of comparison, here is a chart of the Conference Board's Consumer Confidence Index (monthly update here). The Conference Board Index is the more volatile of the two, but the broad pattern and general trends have been remarkably similar to the Michigan Index.

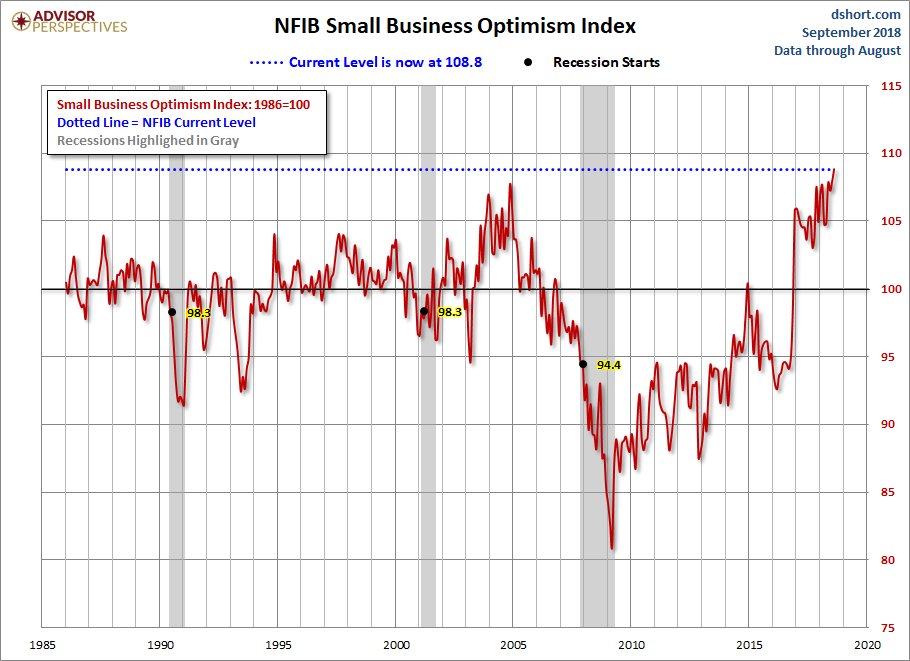
And finally, the prevailing mood of the Michigan survey is also similar to the mood of small business owners, as captured by the NFIB Business Optimism Index (monthly update here).
The general trend in the Michigan Sentiment Index since the Financial Crisis lows was one of slow improvement. The survey findings saw a jump in late 2016 with improvements that have continued through the present.


