
HeadlineCharts - Saturday January 28, 2018
No hint of weakness here. New 52W highs are confirming the indexes as they reach higher and higher.

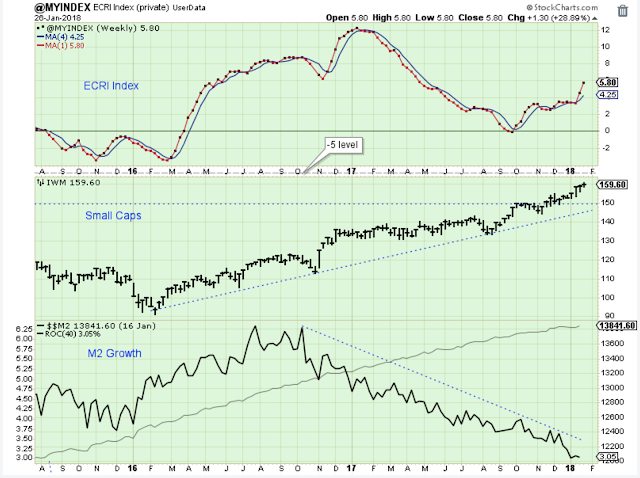
The ECRI told us that Q4 GDP would be weaker than expected, and it was. But now the ECRI index is pointing decisively higher which means GDP is likely pick up again this year.
This was a big week for commodities as the CRB broke above this critical level. It could mark the turning point where, in the longer-term, Technology stocks start to cool off a little, and commodity related stocks start to out-perform.

Okay, earnings have been really good, but are they good enough to justify a chart like this?

None of my charts or technical skills help me in an unstoppable market. All I know is what everyone else knows which is that at some point this market will turn lower, and that it in order regress to the mean it has a long way to drop.

The Long-Term Leader List
The strongest ETFs are blue, the additional leaders are green and the weakest are red. The S&P500 is the benchmark. Disclaimer: This list is not a recommendation to buy or sell.
I am working on revamping this section.
Outlook Summary:
The gains in the stock market have been too much and too easy. Time to be more defensive.
The long-term outlook is positive.
The medium-term trend is up.
The short-term trend is up.
Disclaimer: I am not a registered investment advisor. My comments above reflect my view of the market, and what I am doing with my accounts. The analysis is not a recommendation to buy, ...
more

