World Market Headwinds Escalate On A Shift Away From Harmonic Globalism
In my Market Forecast for 2018, I thought that, taking into consideration the uncertainty of the 2018 U.S. midterm elections, coupled with likely interest rate hikes, we'd probably see:
- volatility rise in 2018 and the SPX and other U.S. Major Indices gain only about half of what they gained in 2017, which would mean an approximate increase of 10% for the SPX
- that Technology would remain fairly strong, while Small-Caps would likely struggle more than Big-Caps
- that U.S. markets would continue to outperform other World markets (with the performance of their financials playing an important part)
WHAT HAS HAPPENED, TO DATE, IN 2018
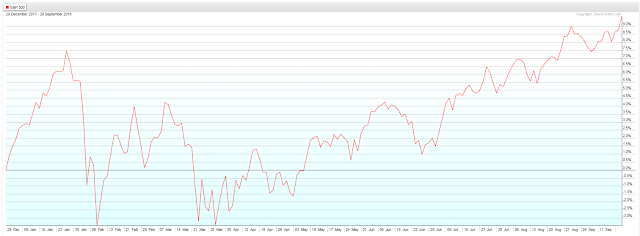
At its all-time high set on September 21 of this year, the SPX had gained 9.62% year-to-date, as shown on the first percentage graph.
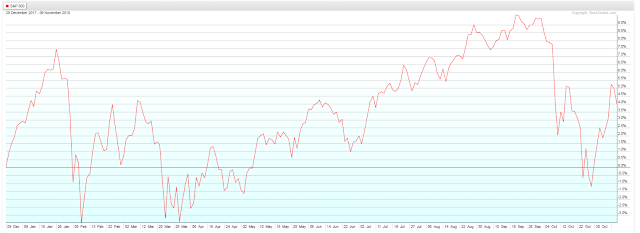
Since then, we've seen profits decline to a point whereby only 4.02% of those gains remain as of today's (Friday's) close, as shown on the second year-to-date graph.
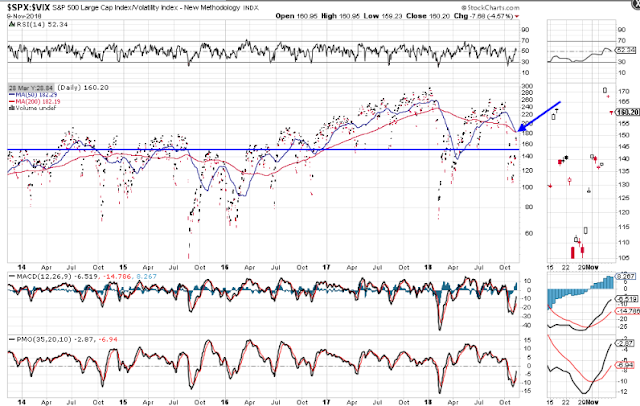
You can see from the following daily SPX:VIX ratio chart that volatility increased greatly (doubled) this year, compared with 2017.
Watch for a bearish Death Cross moving average crossover form in the coming days. If that holds, as well as a drop and hold below 150, we'll see further selling occur in the SPX.
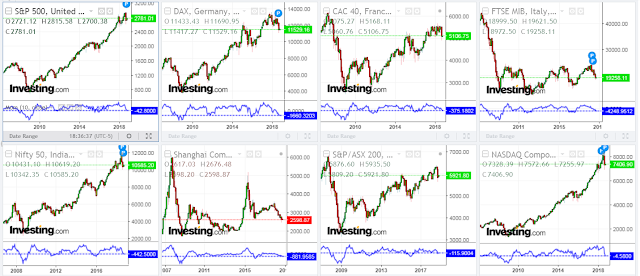
The following monthly charts of the S&P 500, Germany's DAX, France's CAC, Italy's FTSE MIB, India's Nifty 50, China's Shanghai, Australia's S&P/ASX, and the Nasdaq Composite Indices show that the Momentum indicator (MOM) has been in decline all year...MOM is below the zero level on all of them, hinting at further weakness ahead on this longer term timeframe, especially if we don't see strong, sustained, convincing buying come in soon.
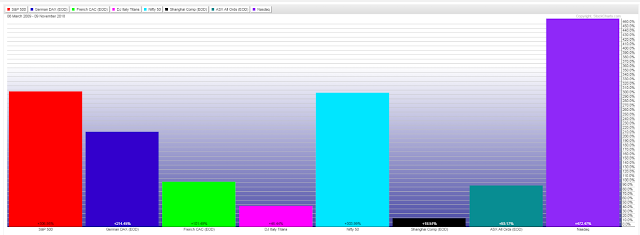
The following percentage graph shows that, from the March 6, 2009 lows of the SPX (666.79) to Friday's close, the Nasdaq Composite has gained the most, while the Shanghai Index has gained the least.
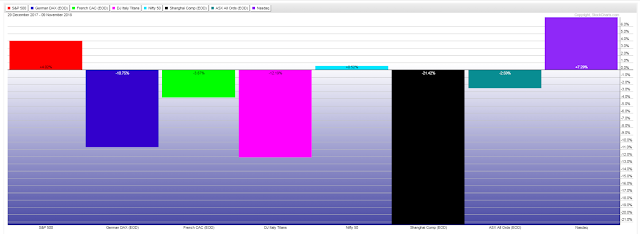
The following year-to-date graph shows that the Nasdaq Composite is the strongest, while the Shanghai Index is in bear market territory.
Not shown on this graph is the Russell 2000 Index, which has only gained 0.91% YTD and has, in fact, struggled more than Big-Caps since it began to decline after August 31, at which point it had gained 13.37% from the beginning of the year. It's in correction territory.
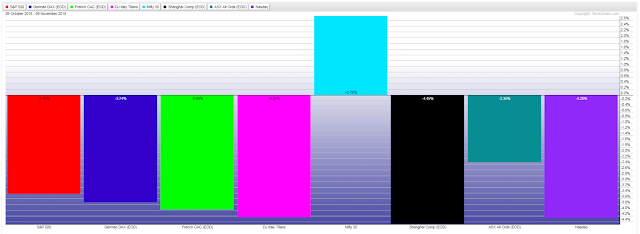
The following one-month graph shows that buying has occurred in the Nifty Index, while selling has accelerated in the others.
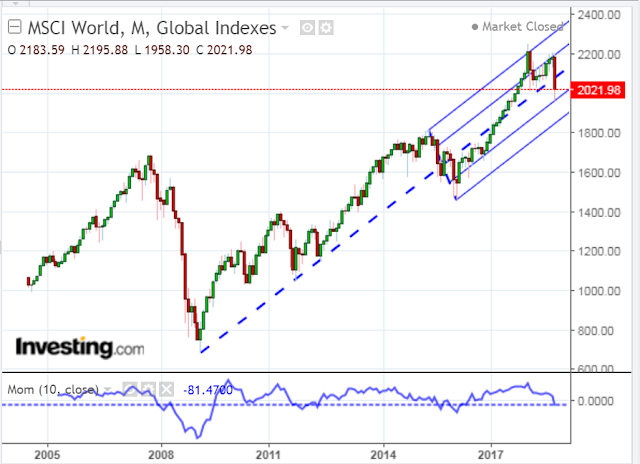
The following monthly chart of the MSCI World Index shows that price pierced below the median of a long-term uptrending Andrew's Pitchfork formation on accelerating downward Momentum (MOM) and is attempting to bounce back to its median.
Failure to recapture and hold above its median, together with continued downward MOM, will indicate further weakness ahead for major world indices.
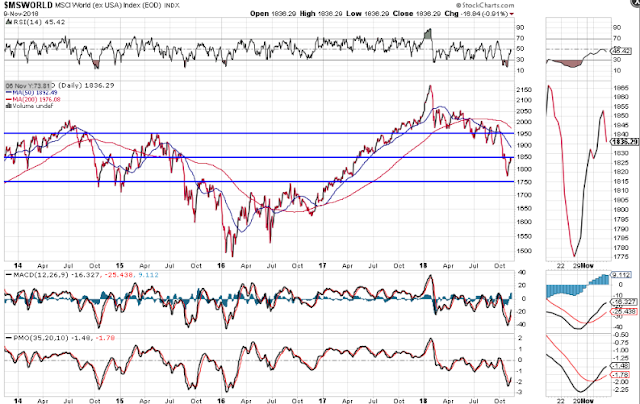
The following daily chart of the MSCI World Market Index (ex USA), shows how weak other world markets are in comparison with the U.S. markets.
Failure to recapture and hold above 1850 could see this Index retest its 1750 level. If that happens, I think we'll see further selling in the U.S. markets.
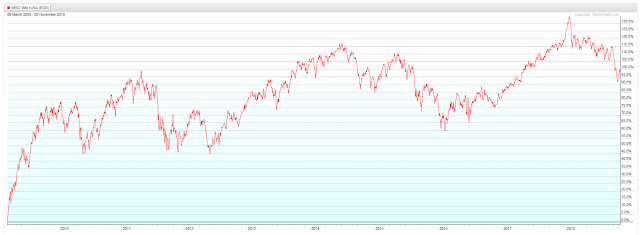
The following percentage graph shows that the MSCI World Market Index (ex USA) gained 101.09% from March 6, 2009 to Friday's close.
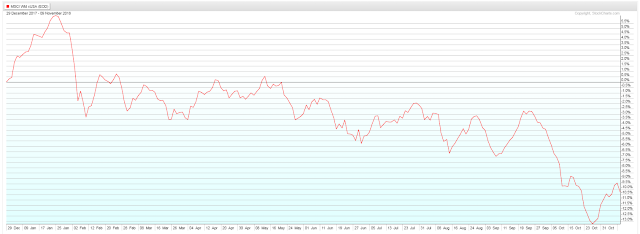
The following percentage graph shows that the MSCI World Market Index (ex USA) has lost 10.27%, so far this year, and is in correction mode.
CONCLUSIONS
Based on the combative political rhetoric I've seen leading up to and, especially, since the U.S. midterm elections this week, I think that will increase on all sides (Democrats, Republicans, media, and President Trump) until the 2020 elections. In fact, I think that will be like what we've witnessed in 2017/18 on steroids.
I'll go so far as to posit that Democrats have (unwittingly and conveniently) now become the President's scapegoat, so that when the U.S. economy slows in 2019 and shows signs of recession in 2020, he can simply blame Dems for obstruction, gridlock and a waste of taxpayer dollars on endless investigations into his administration. It will cannibalize some (or a considerable amount) of the economic and market gains made since the Presidential election in November 2016 under Trump, and he will accuse Dems of destructive governance and legislative failure as a platform on which to run in 2020.
A failure of U.S. and world markets to recapture convincing sustained buying and to reduce volatility, coupled with escalating domestic and foreign political unrest, as well as President Trump's trade wars and a world-wide shift from an embrace of harmonic globalism to a more divisive world order of nationalism/protectionism will signal, either continued market gridlock/consolidation, or escalating weakness.
Government, corporate, banking, and/or personal debt crises will determine exactly if/when the 9-year bull market bubble blows up, I think.
CLOSING REMARKS
Appearing in the Profile section on my trading blog is the following:
From volatile, whipsaw market action (as evidenced in the above charts and graphs), contentious world-wide political rhetoric and actions, weakening global financials, military buildups, and even increasingly severe weather disturbances, etc., so far this year, I'd say that all three of those behaviors are in retrograde to some degree or other. It's unlikely all of it will abate any time soon.
Buckle up!