Why We See Value In Something That Is No Longer Value
Barring unforeseen circumstances, later this January marks the two-year anniversary of the start of the current emerging markets (EM) bull market. Since bottoming out on January 21, 2016, the MSCI Emerging Markets Index has rallied an impressive 70%. While some investors may be becoming hesitant on the asset class after the expansion in valuations, we see others remaining bullish on its outlook.
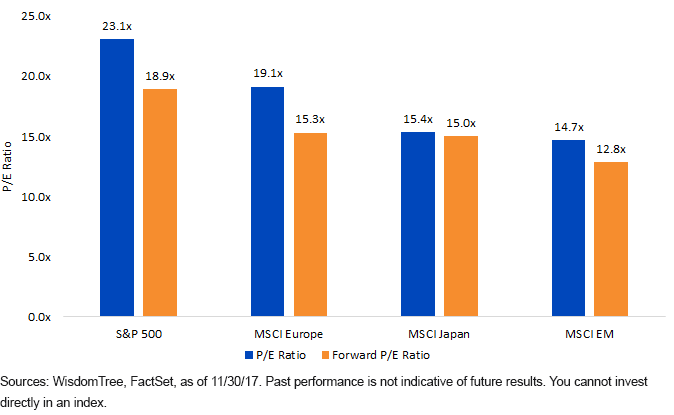
As value investors, we are constantly assessing asset valuations and searching for where the best opportunities exist. Looking across the globe right now, we think EM still represents the best equity valuation opportunity on an absolute and relative basis.
Global Equity Index Valuations

Value Is More Than Just a Number
That said, context is needed to tell the whole story. Value investing requires more than just looking at a group of numbers at a given point in time and selecting the smallest one.
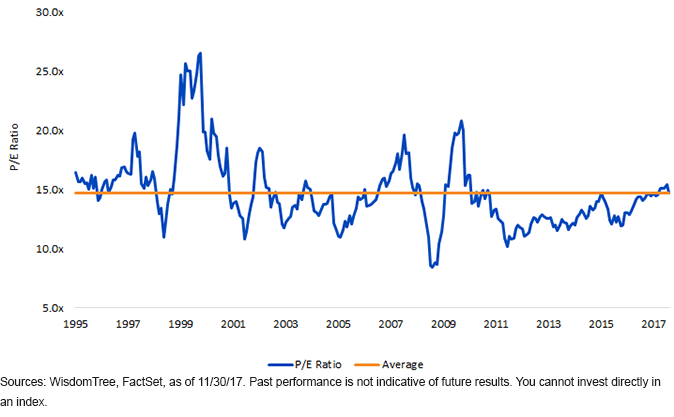
EM is currently trading almost exactly at its long-term average P/E ratio dating back to the mid-1990s—a span of time that includes periods of boom and bust for the asset class. Even with the 70% rally over the last two years, EM is right at its historical fair value.
MSCI EM Index Historical Valuations

Equity Transformation Leading Economic Transformation
While EM’s current valuation paints a picture of fair value, we think there’s a more important story taking place beneath the surface that isn’t receiving enough recognition. Much fanfare has been made about the gradual transition within EM from the old economies to new ones, but less ink has been spilled on the fact that the equity markets have already seen this transformation take place.
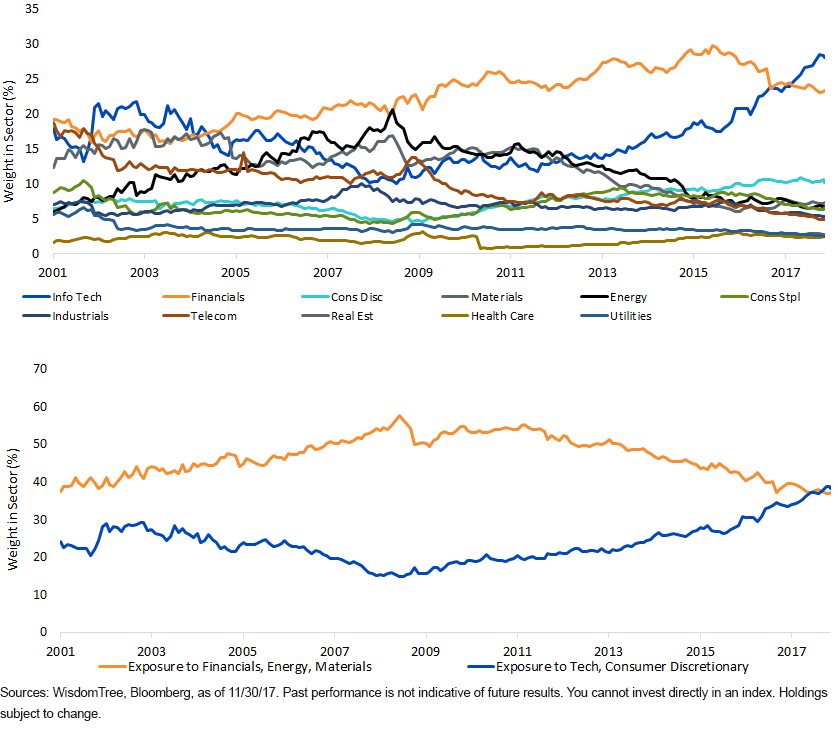
For much of its history, the EM equity asset class was dominated by some of the sectors that are traditionally associated with value investing—Financials, Energy and Materials (the latter two being the primary commodity-linked sectors). This was particularly true during the mid-2000s commodity super cycle, when those three sectors combined for a whopping 58% weight in the Index at their peak. In recent years, the asset class has matured to one with larger exposures in the new economy sectors that are more closely aligned with growth investing—namely Tech and Consumer Discretionary.
In fact, this past September, the combined weight in those two growth sectors surpassed that of the three value sectors for the first time—a trend that certainly looks like it may continue. What was long seen as a value asset class that was reliant on commodities has finally made the leap into the long-awaited play on the EM consumer growth story.
Composition of MSCI EM Index Dynamically Shifting

Buying Growth at Value Prices
Back to valuations. Today we find ourselves comparing EM’s current valuation to its own history—a history of being a value-dominated asset class. The composition of the Index has clearly changed to an equity market that is driven by growth, but the current and historical valuation levels are the exact same.
Therefore, we see value in EM because it is no longer value. Put another way, imagine if the Russell 1000 Growth Index were trading at the historical P/E ratio of the Russell 1000 Value Index.”
Given this evolution, in our view, historical valuation comparisons understate the real value being offered by EM. Even after the run since January 2016, we believe EM equities still represent a fantastic value opportunity on an absolute, relative AND historical basis.
And while valuation alone is not a catalyst, there are a few potential tailwinds in the coming months that we’re monitoring closely:
- Strong projected earnings growth this year (with consensus growth at around 13%)3
- Continued easy policy from most EM central banks
- Strengthening EM currencies that still look undervalued on a PPP basis
- Near-universal improvement in financial accounts from 2013 levels
- An expected acceleration in the global and EM GDP growth rates
With all that in mind, we have reason to remain bullish on EM going into 2018.
Best Ideas for 2018
In terms of portfolio implementation, we like a few themes for 2018. These include the continued rally in large tech names that have high expected earnings growth; accessing local economy exposure with the pickup in EM GDP growth; and India, arguably our favorite long-term story, as the impact of demonetization and the GST bill rolls off.
The WisdomTree Emerging Markets ex-State Owned Enterprises Fund (XSOE) has over-weight positions in Tencent, Alibaba and Baidu, each of which has long-term EPS growth expectations above 22%. The WisdomTree Emerging Markets SmallCap Dividend Fund (DGS) derives 81% of its revenues from within emerging markets and should benefit from a pickup in internal economic activity. Finally, The WisdomTree India Earnings Fund (EPI), which celebrates its 10-year anniversary in February, takes our patented earnings-weighted approach to magnify the impact the top earnings generators have on the total strategy. Looking ahead, we think each of these strategies is well positioned to effectively capture the changing dynamics of the asset class.
Disclaimer: Investors should carefully consider the investment objectives, risks, charges and expenses of the Funds before investing. U.S. investors only: To obtain a prospectus containing this ...
more


