
Weekly Wave Analysis EUR/USD, GBP/USD, USDJPY - Monday, June 12
EUR/USD
The EUR/USD could still be part of the wave 2 (green) unless price manages to break above the invalidation level which is the 100% Fibonacci at 1.13. A break above this invalidation level would indicate that the downtrend on the weekly chart could be completed.
Daily chart:
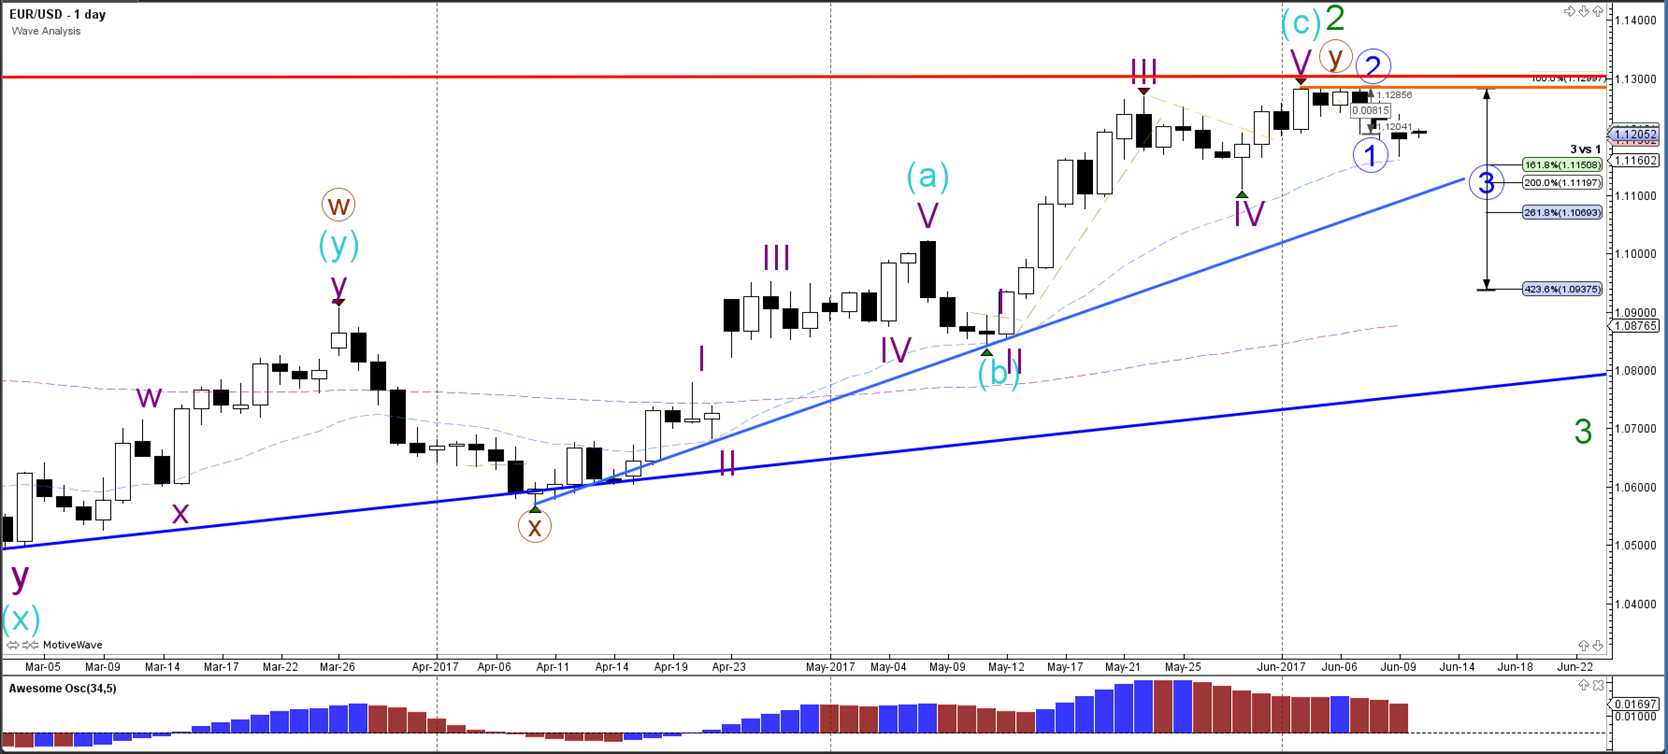
The EUR/USD could be building a retracement as part of a wave 2 (green). A bearish breakout would confirm a wave 3 (green) within a wave 5 (blue) but a bullish breakout above 1.13 changes the wave structure.
Weekly chart:
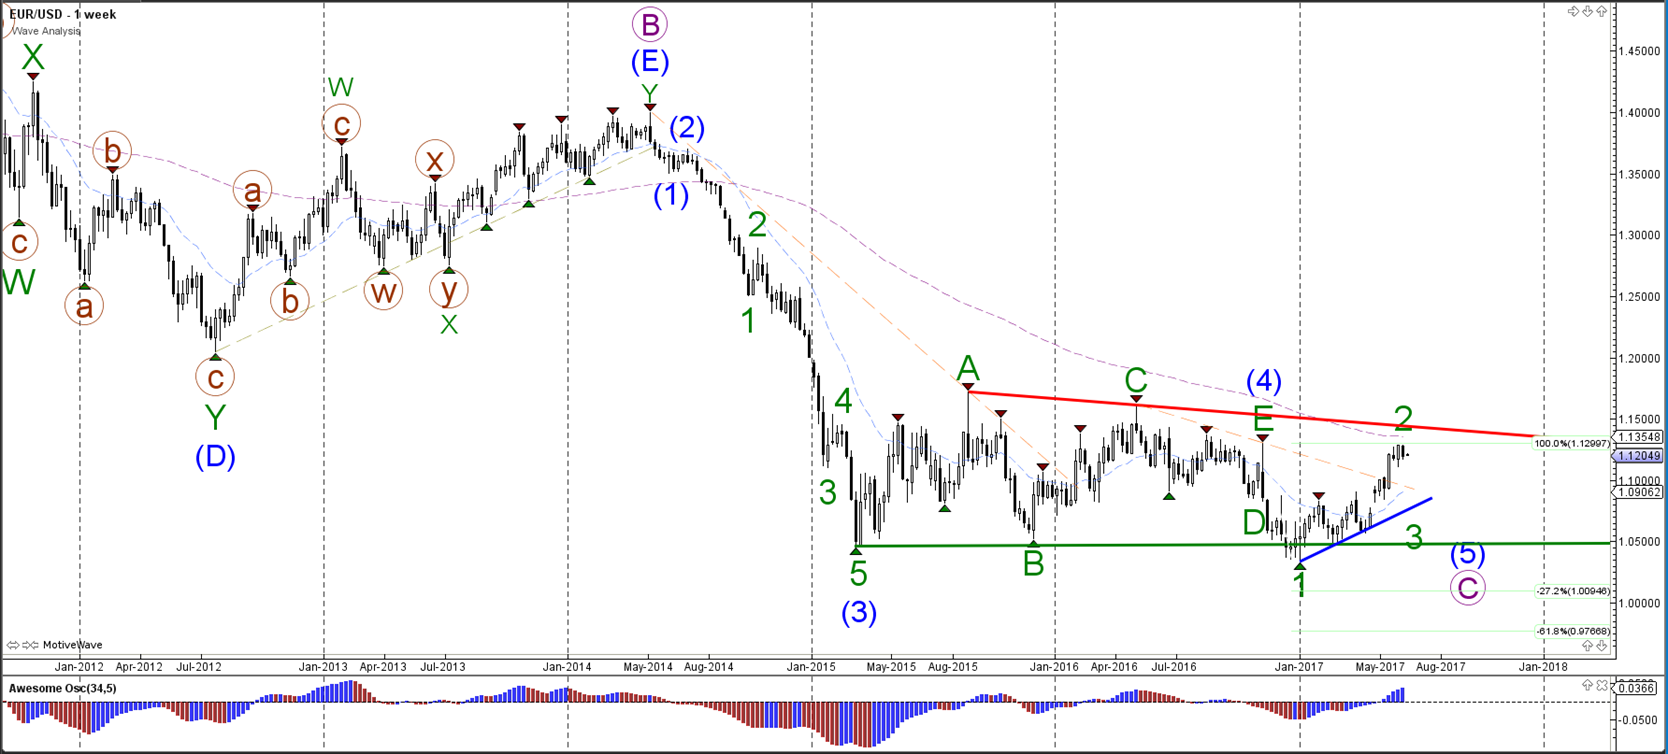
The EUR/USD is potentially building a larger correction between support (green/blue) and resistance (red).
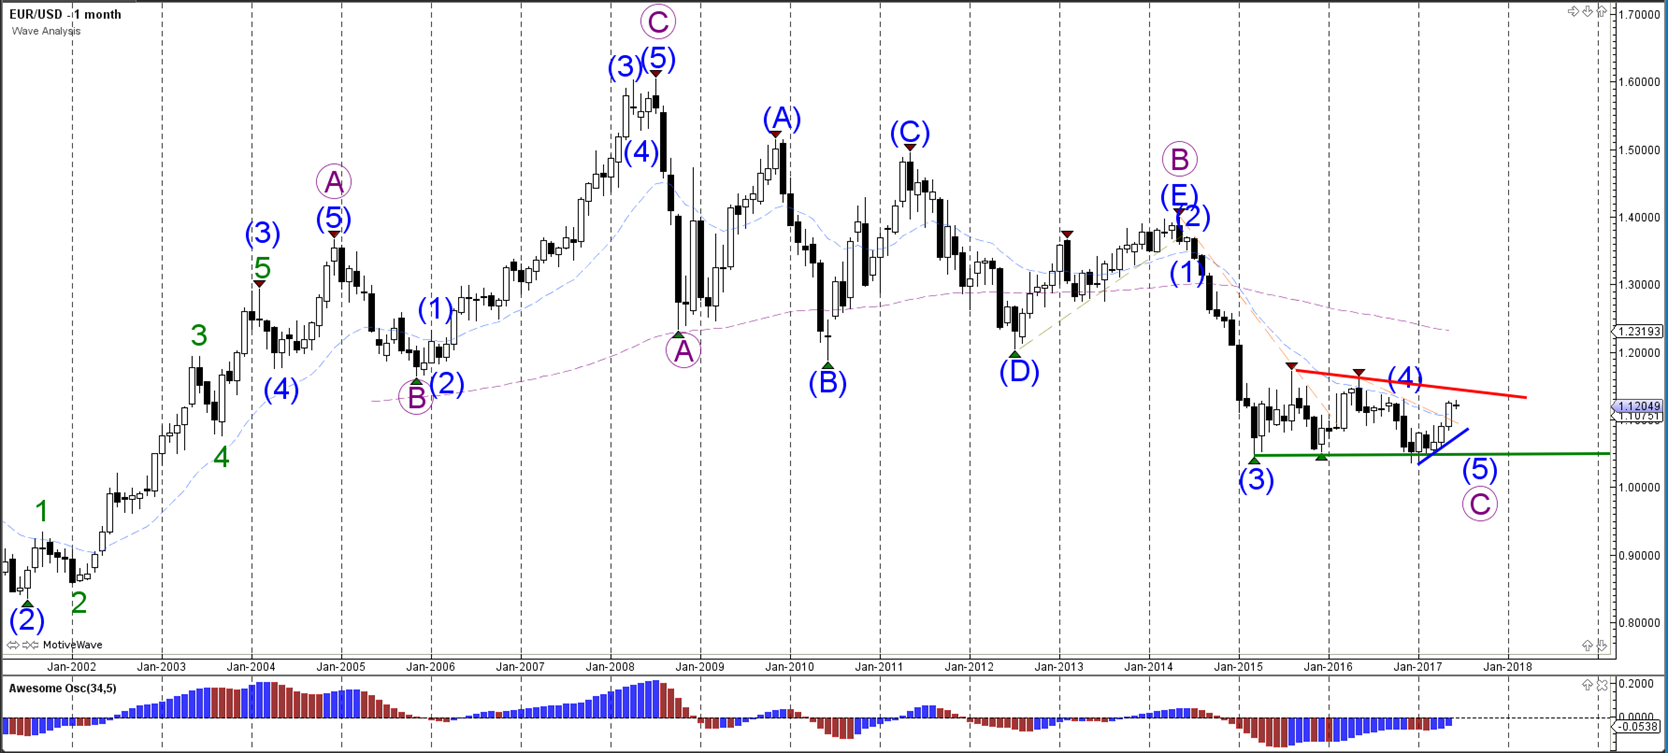
Monthly chart:
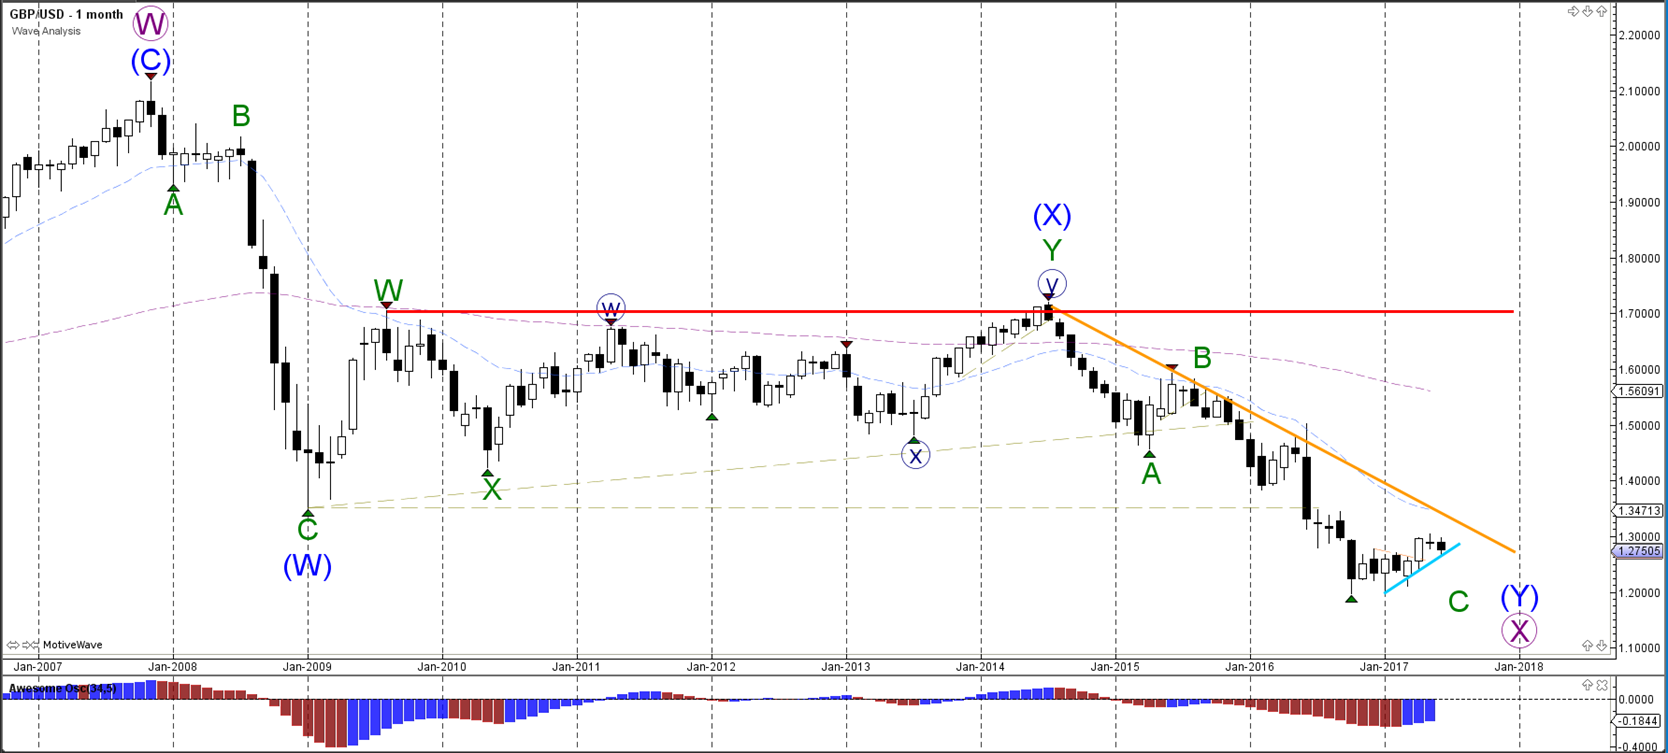
GBP/USD
The GBP/USD has two likely wave scenarios and will depend on the breakout direction: above or below the support and resistance (S&R) trend lines. The bullish scenario is where the Cable is completing a retracement within wave 4 (green). The alternative is a bearish reversal as indicated by the impulsive wave 123 (red).
Daily chart:

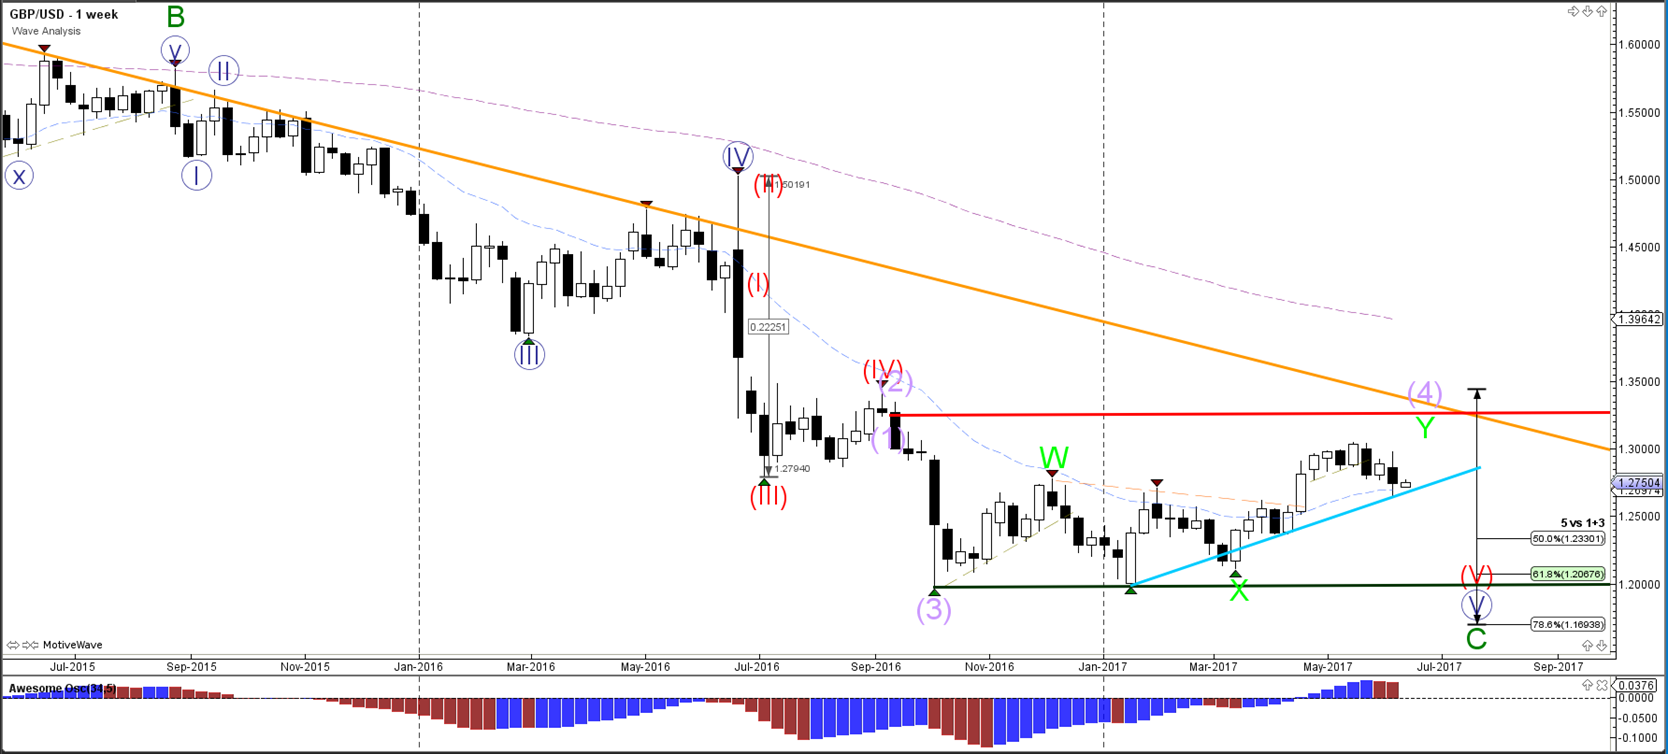
The GBP/USD weekly chart is showing a sideways consolidation within a larger downtrend. Price is most likely building a bullish retracement to the resistance levels (red/orange) but a break above those resistance levels would change the wave structure.
Weekly chart:
The GBP/USD has been in a downtrend as part of an ABC bearish zigzag (green), which could be completed if price manages to break the resistance on the weekly chart.
Monthly chart:
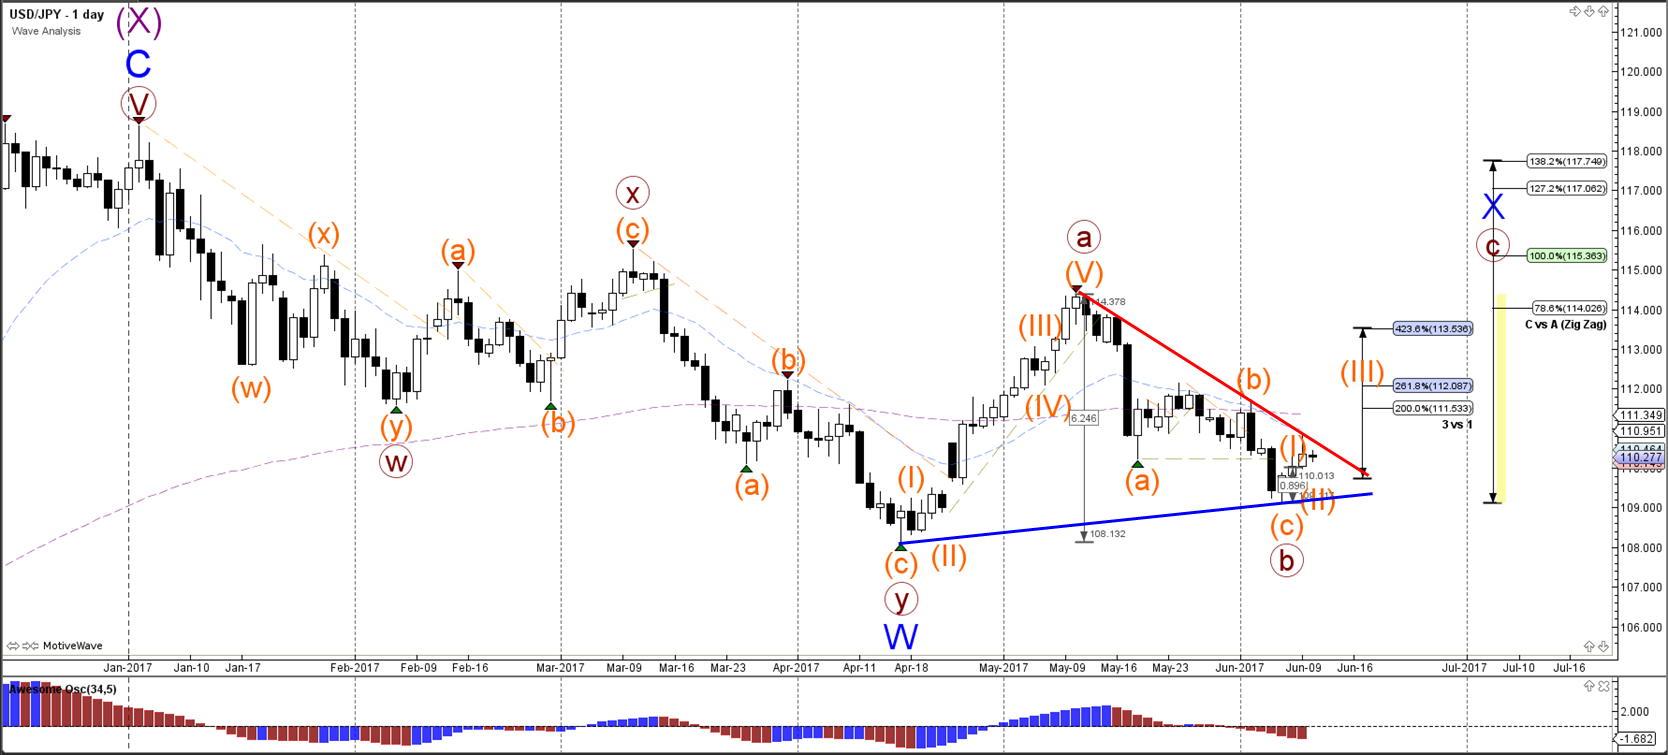
USD/JPY
The USD/JPY could have completed an ABC (orange) within a larger ABC (brown). A break above the resistance trend line (red) indicates that the wave B (brown) has been completed whereas a break below support (green) indicates that the wave B (brown) is still open.
Daily chart:
The USD/JPY is retracing back to the Fib levels of wave B (brown) and could be building a larger ABC (brown) correction back to resistance trend line (red).
Weekly chart:

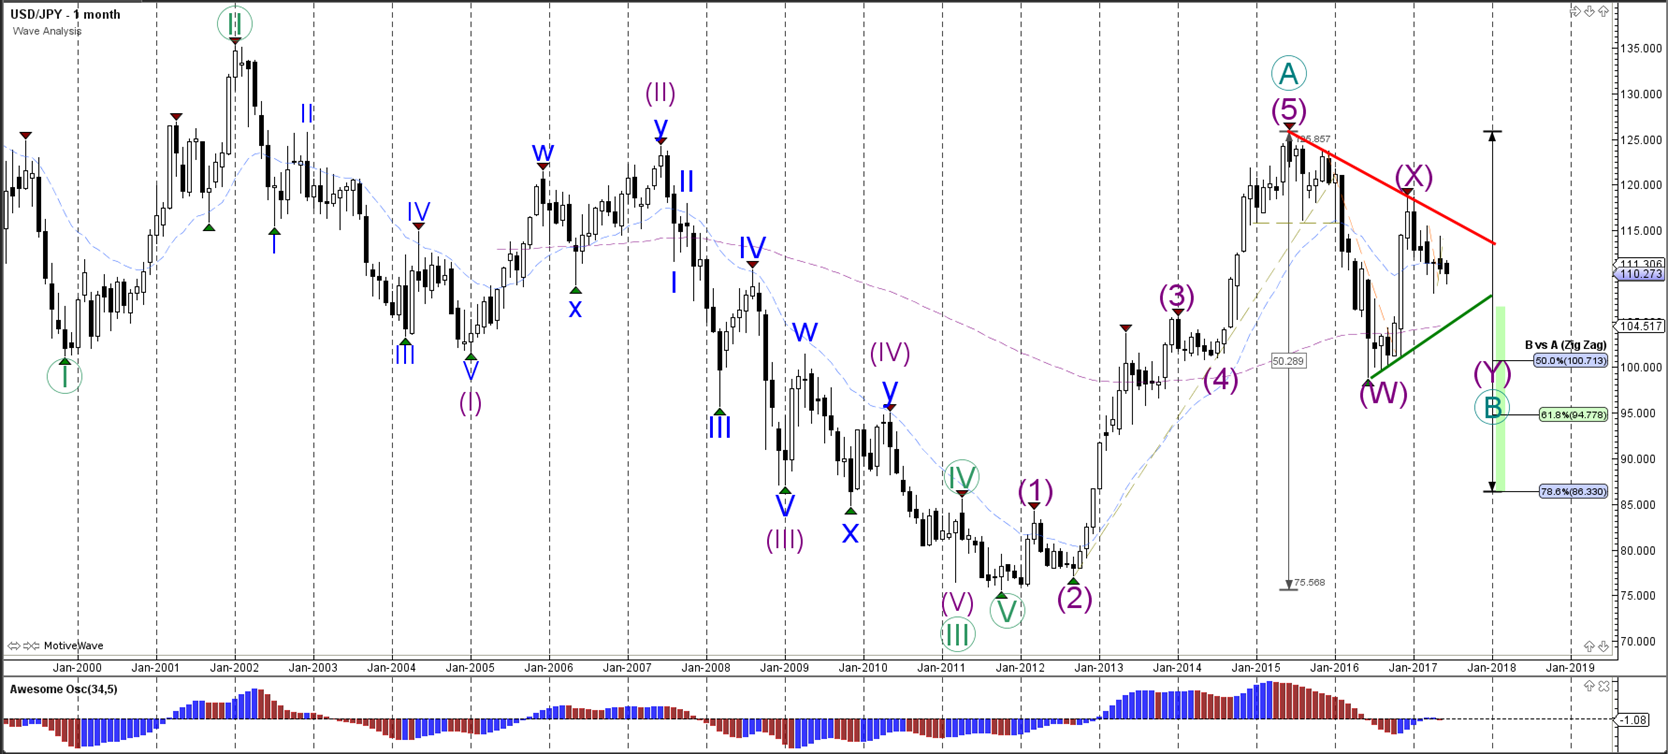
The USD/JPY is building a triangle correction (red/green lines) or correcting towards the Fibonacci levels of wave B (green).
Monthly chart:
Disclaimer: Risk warning: Trading foreign exchange or contracts for differences on margin carries a high level of risk, and may not be suitable for all investors. There is a possibility ...
more

