
Weekly Research Report Vol. 6 : Global Markets
HIGHLIGHTS:
- Dow Jones Industrials hits key 25,000 price level, with its eye on both 27,500 and 29,400.
- US Dollar Index signals a long-term bear market, but for the short-term it may experience a counter-trend rally.
- Inversely, commodities (CRB) have had a spectacular bull run, but now point to a short-term pullback to 440.
- Oil has risen to anticipate geometric resistance of $61.79 its cumulative average, but may pull back to the $54 - $55 price area in the near-term.
- Bitcoin is indicating a continuation of the larger bull run, as expected, with $24,920 as the potential next top.
DOW JONES INDUSTRIALS (DJI)
- DJI reaches key pivot of 25,000.
- Watch for reaction from the 25,000 price zone for next direction, either continuation of uptrend in the near-term or interim retracement prior to larger bull trend continuation.
(This analysis is a follow-up to the identification of 25,000 as the next major resistance area in our September 25, 2017 article.)
The Dow’s triumphant rise to 25,000, which was reached last week, marks the next phase of activity, as per this enhanced and updated chart outlining master support and resistance:
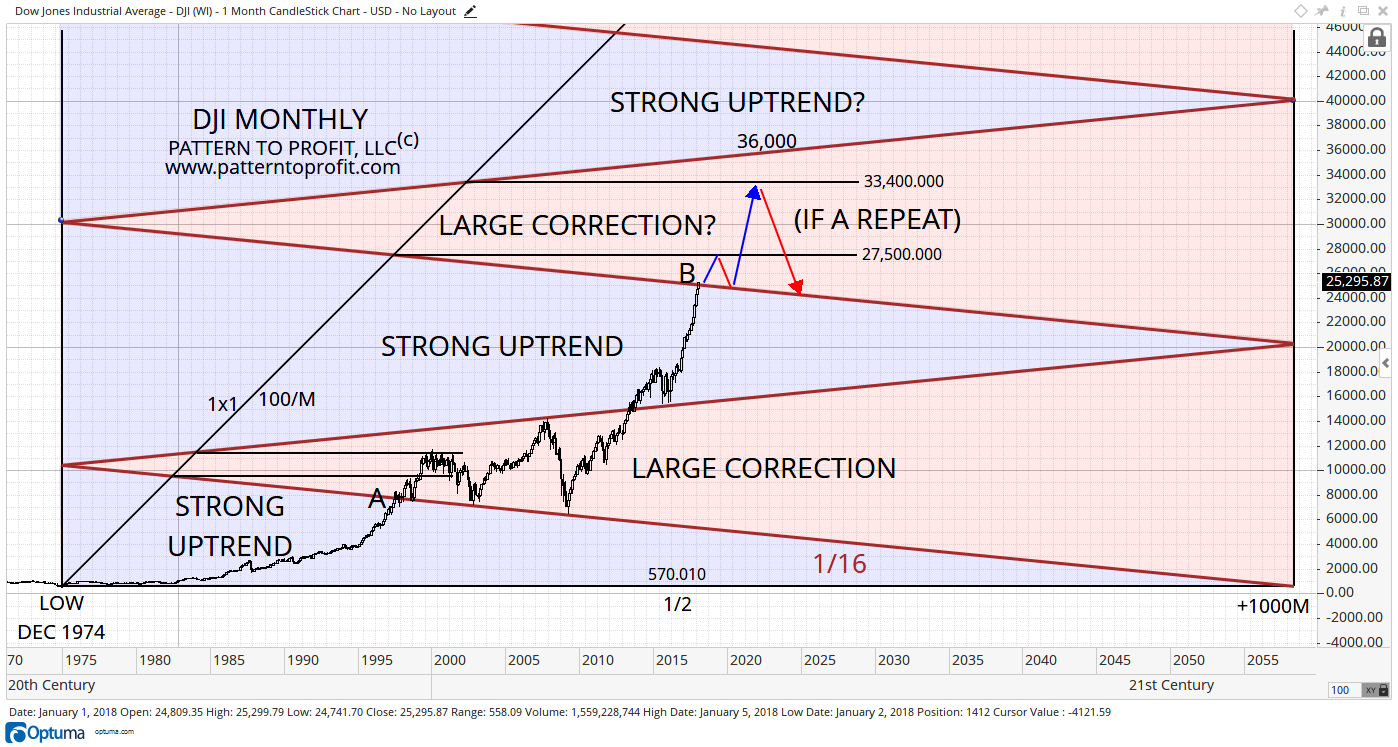
Note the dramatic difference in market movement between the blue and red shaded areas.
Just as it did previously at point A, the Dow is now entering the next large correction area (point B), invoking concerns of an eventual large bear market. However, it has quite a way to go before the upper levels of this area become a realistic concern (33,400 to 36,000).
The prior price movement from point A to the tops of 1998 and 2000 and their respective drops back down to support are carried forward to the current market (blue and red lines/arrows). A perfect repeat would yield the indicated movements.
Naturally, if the market does not maintain prices above 25,000, support is expected at prior resistance of 22,400, as discussed in the September 2017 article.
Keeping in mind that 27,500 is the next higher resistance level, we move on to an entirely different analysis approach, yet yielding eerily similar results. By using square numbers x1000 as support and resistance levels (more importantly, the space between the levels, as divided fractionally) a major market movement seems to be repeating here as well:
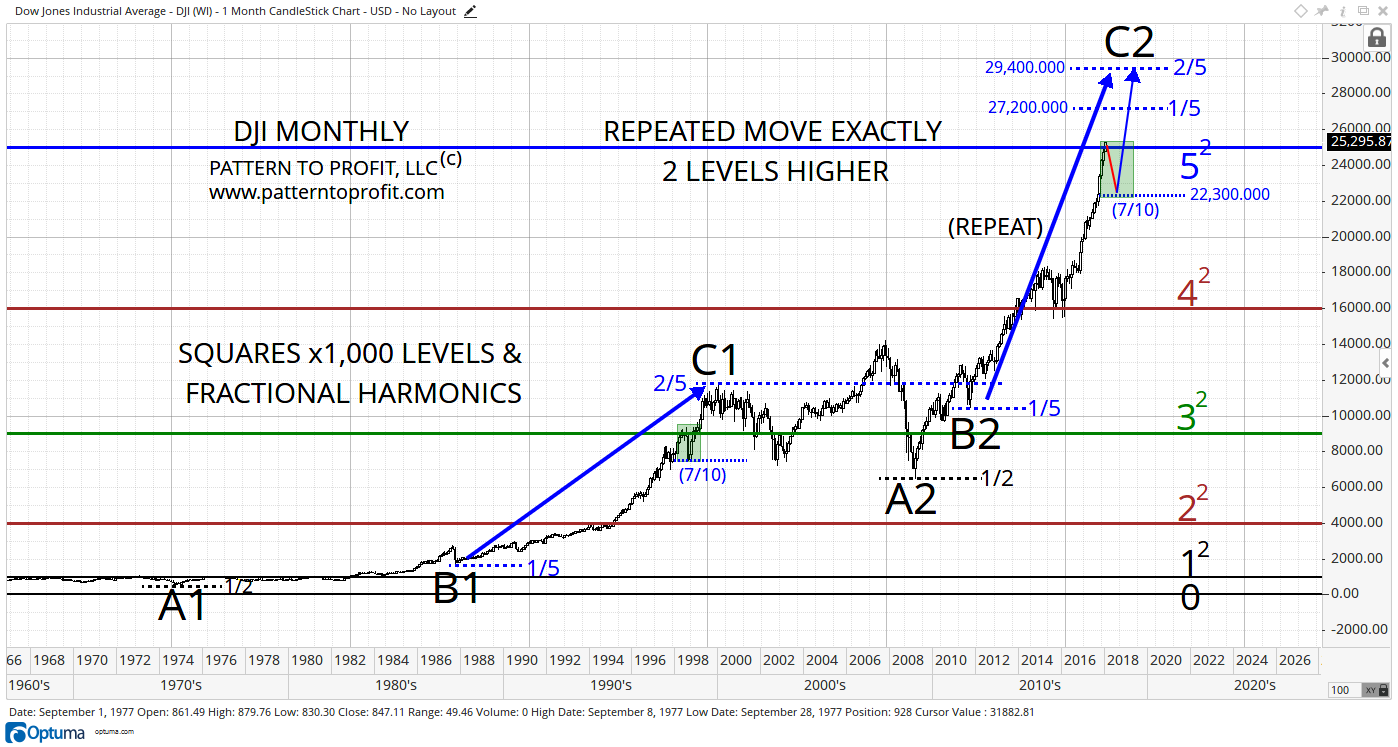
The relationship of major lows of March 2009 at 6,469.95 (A2) and October 2011 at 10,404.49 (B2) are a perfect repeat of the two proceeding important lows of December 1974 at 570.01 (A1) and October 1998 at 1,616.20 (B1). These two sets of lows occur at a 1/2 level followed by a 1/5 level in the next range, but are two full ranges apart from each other.
By noting the major high of January 2000 at 11,750.28 (C1) on a 2/5 level in its respective range, the corresponding 2/5 target level of 29,400 is the main prediction for the next major high, However, this level does not show up on the previous analysis, unlike the 1/5 level of 27,200 which loosely aligns with the 27,500 target.
In addition, the first shaded area covers the correction of 1998, as a brief observance of resistance from 9,000 (the green 32 x1000 level) and a subsequent bounce on a 7/10 level of 7,500. If the current market does not hold above 25,000, a repeat of this activity could be expected, with a corresponding 7/10 support level of 22,300. Note the alignment with the 22,400 support level mentioned earlier.
In summary, two completely different approaches yielding similar levels; perfect harmony.
US DOLLAR INDEX (DXY)
- Dollar breaks below key long-term circular support, which signals a bearish trend continuation.
- Nevertheless, in the short-term watch for counter-trend bounce.
- Long-term lower target now from around 90.015 to 89.828.
(For a more detailed dollar analysis, please refer to last week’s article from January 3, 2018.)
In November 2017 the dollar broke through and closed below major circular support. Subsequently the dollar strengthened off this support area, but as of December’s monthly close it has confirmed the bearish signal. In addition, December’s close was a lower monthly close, the lowest since December 2014! The current market is consolidating after such a bold statement:
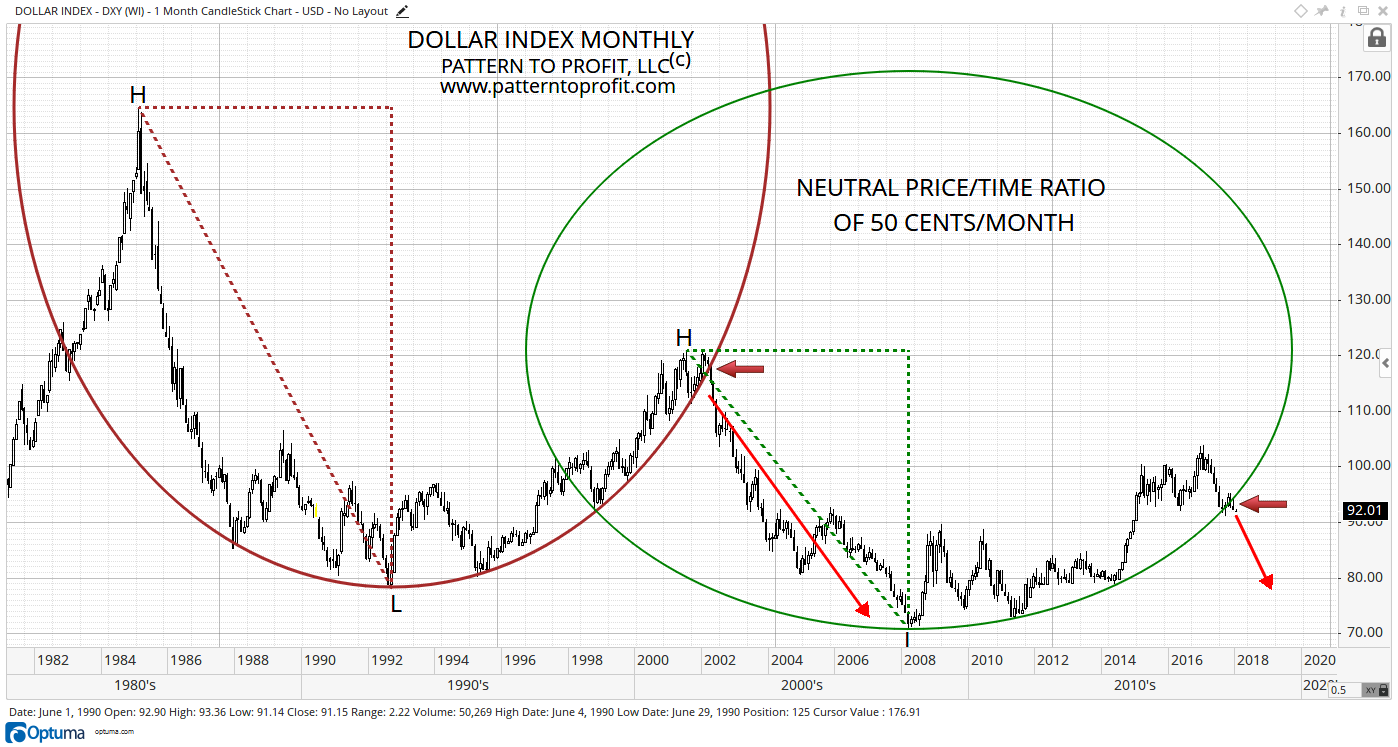
The gravity of this breakdown is revealed by the previous identical activity (sideways red arrows), which produced the rather crushing large downtrend to the March 2008 major low of 70.69.
For the short-term, alignments of levels from the recent trend line break offer strong support areas:
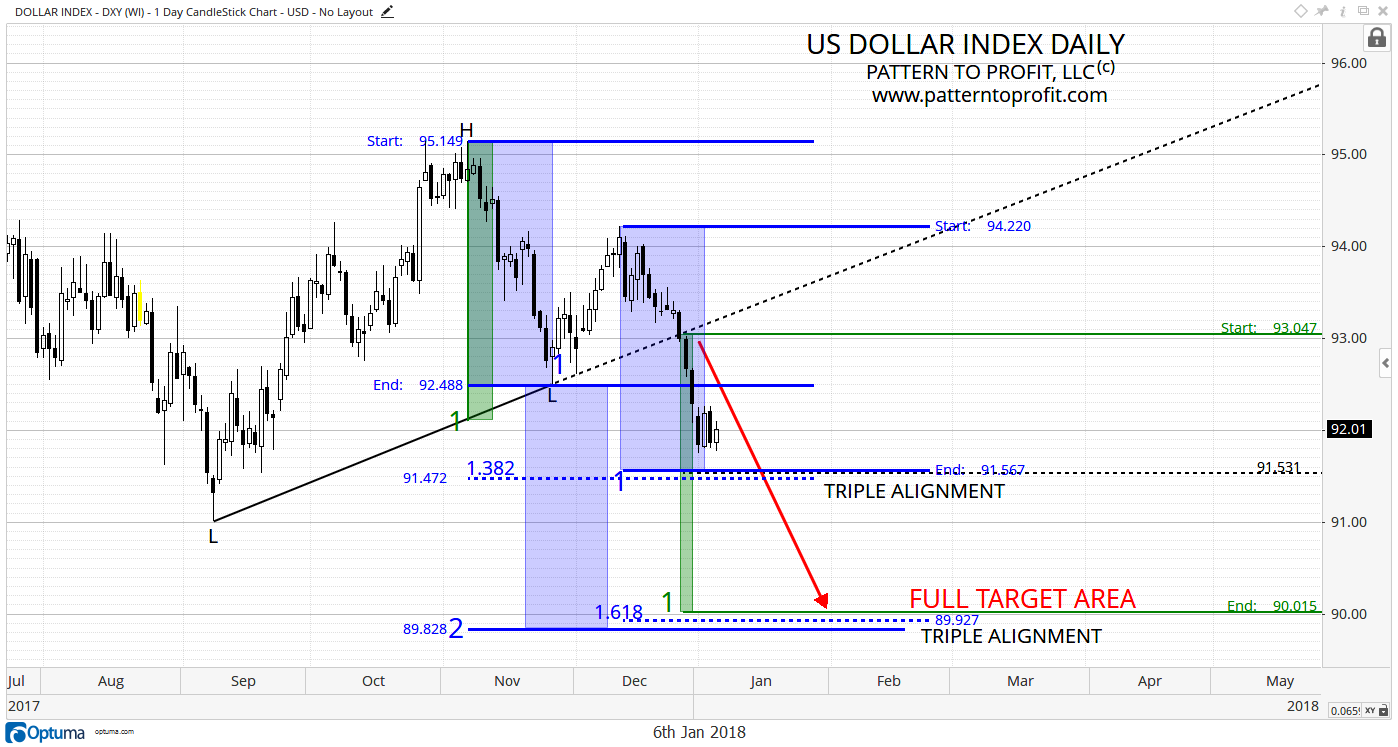
A traditional trend line target (and 50% level) are offered (green rectangles and levels), as well as a measured move and a doubling of the first downtrend (marked H-L). Fibonacci levels are added when necessary.
It is interesting to see how the various methods identify price levels that align closely in two distinct areas:
- 91.531 – 91.472. This area marks 50% of the full target (black dashed).
- 90.015 – 89.828. Full target area, as measured from the high to the trend line directly below, then subtracted from the breakdown point on the trend line (green).
The current market consolidation is noticeably above the first triple alignment, which indicates that this is not an impending directional shift for the dollar. A short-term reversal is much more likely to occur at either of these areas of alignment, with a stronger expectation for the full target area (thank you Tom DeMark).
CRB INDEX
- Geometric analysis higher targets up toward 437 - 440.
- In the near-term watch for pullback. Once complete continuation of larger bullish trend off June 2017 lows should resume.
As expected with a falling dollar, the commodities index rose sharply. This was anticipated from this parabolic structure clearly showing harmonic relationships that hint at the next move to come:
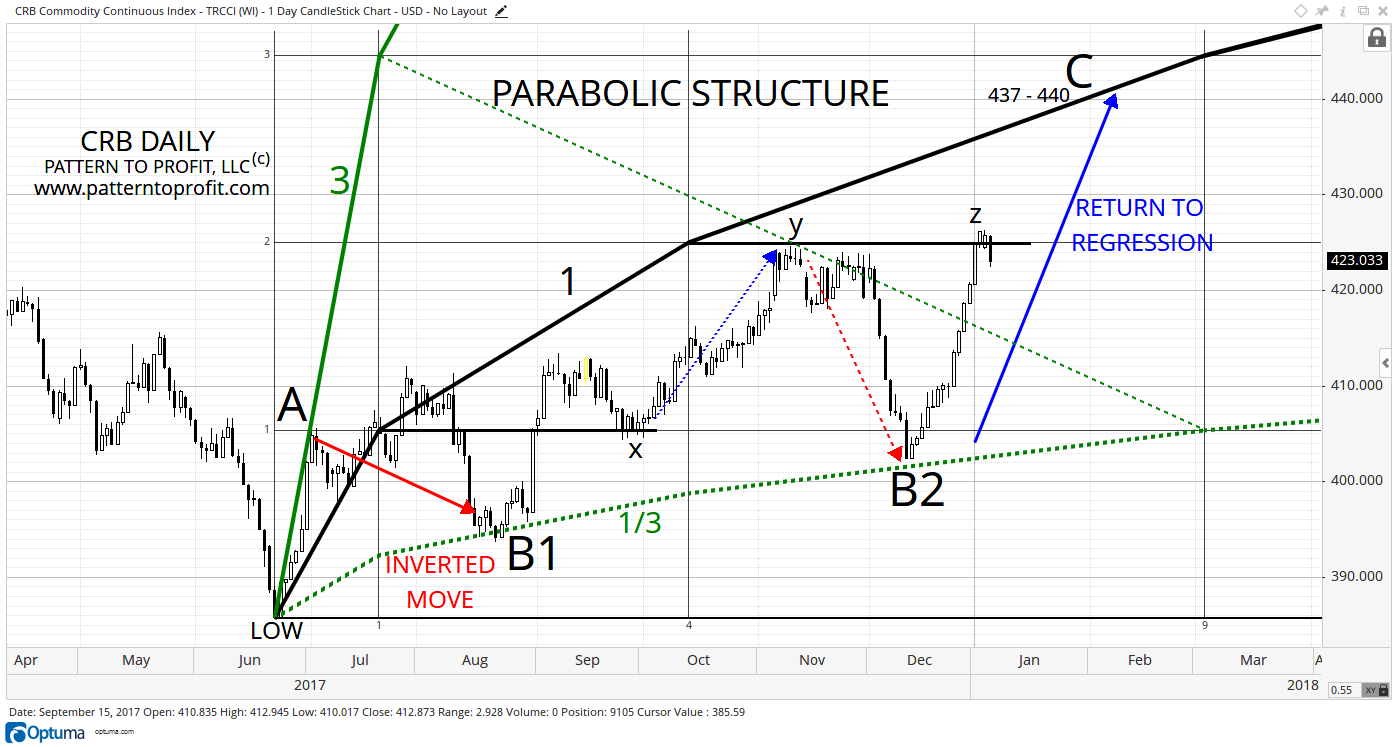
According to this structure, the top at point A registered with curve 3 (solid green). The subsequent lows at points B1 and B2, both on the 1/3 curve (dashed green), are perfect inverted reversals to the top at A. This indicates that the main curve 1 (solid black) is functioning as the geometric mean, and the market will be attracted to this curve through regression: hence the expectation that the CRB will return to this main curve, possibly in the 437 – 440 range (point C). (Please refer to the parabolic analysis of the S&P 500 from November 5/7, 2017, for other examples of this phenomenon):
(Notice at points x and y, the market responded almost perfectly to support and resistance from parabolic price levels (generated from the square root of the low). This activity sidetracked the market’s attempt at regression upon completing the inverted move from curve 3 to curve 1/3. However, the current market managed to exceed resistance with two consecutive closes above, on January 3 and 4 (point z), and therefore stands apart from prior activity at x and y. This has bullish implications, and agrees with our overall bearish dollar perspective.)
CRUDE OIL
- Crude reaches a potential interim resistance zone of the cumulative moving average.
- A breakout to new highs for the current trend points to a near-term continuation of the bull trend.
- Short-term resistance might also be seen down to $54.
- Higher targets are up around $73.53.
As expected, crude oil has been making gains after breaking out of its cumulative average resistance (brown) in November (starting from the high at H3). In fact, it has now reached the next average (red) from the prior high at H2:
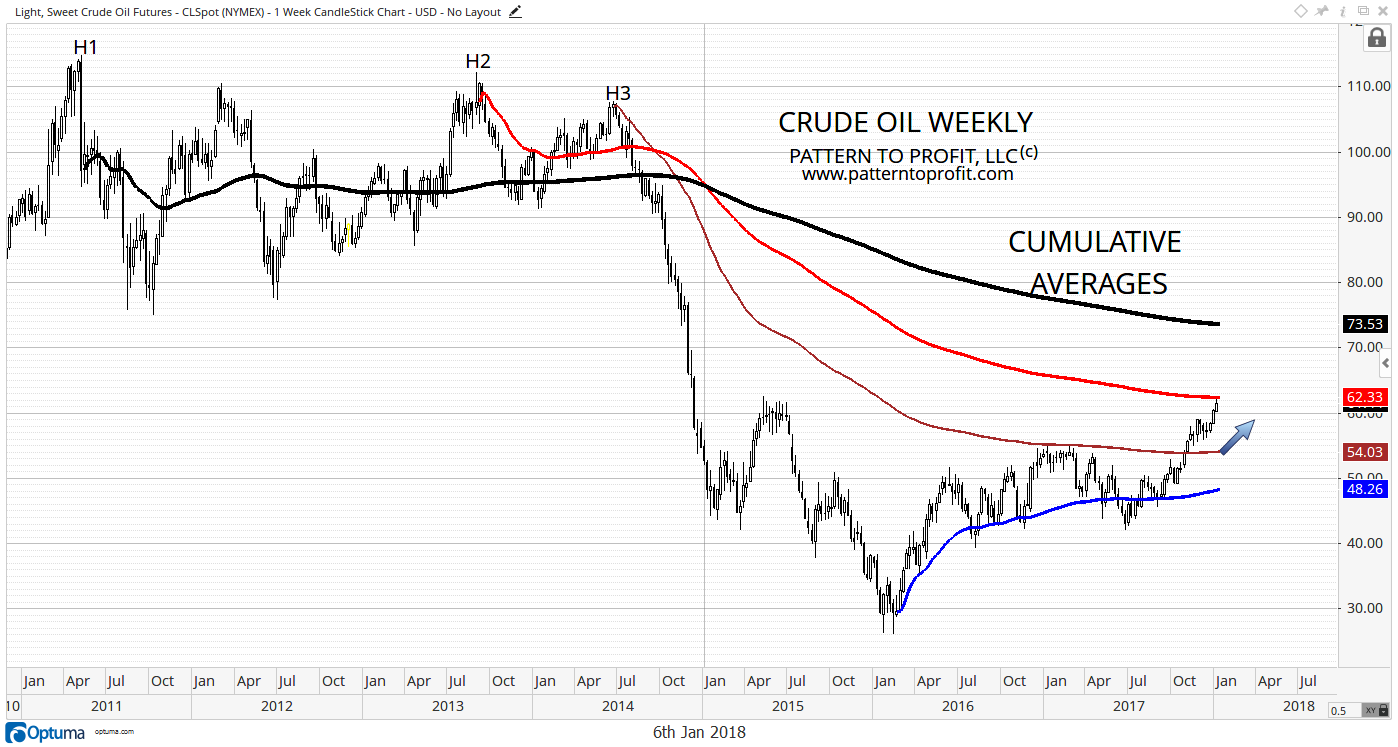
If the market respects this resistance, then a drop back down to support at the brown average is expected. That price level is currently just above $54, and the brown average is now rising for the first time (blue arrow), which is bullish.
Secondary support (in case of a crash or extended drop) is offered by the main support average (from the major low) currently at $48.26.
On the upside, if the market breaks above resistance, then the black cumulative average from the high at H1 offers resistance currently at $73.53.
From a larger perspective, oil is attempting a break out of resistance of around $61.79, at the midline of the wave interference pattern as seen below:
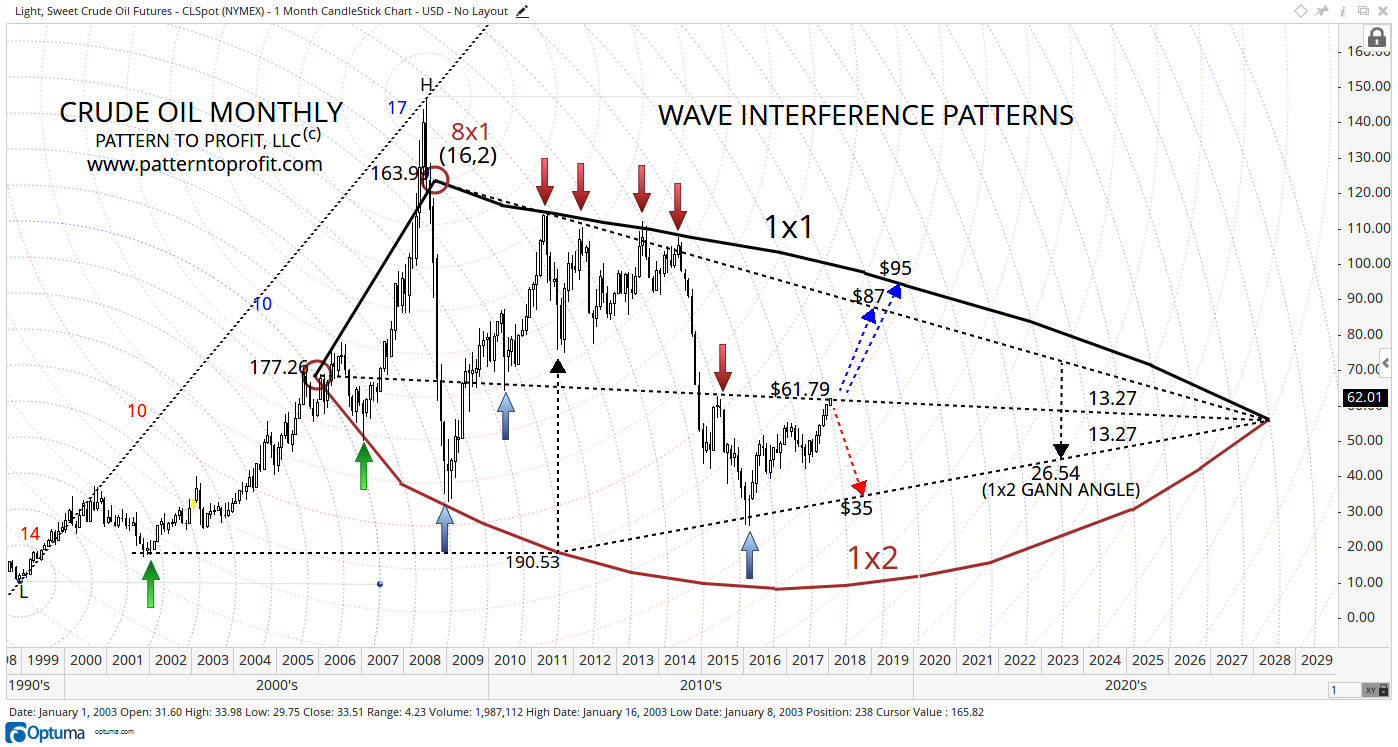
If successful (now or after a pullback), the upside is between $87 and $95 in the near future.
On the downside, if the market unable to break out, then a drop to $35 is not unreasonable.
BITCOIN (XBT/USD)
- If Bitcoin continues to hold above $15,300 it should proceed to new highs.
- Key upside target now around $24,919.
- Interim resistance may be seen around $17,900, followed by $19,337.
(Please refer to our recent Bitcoin Update article from January 1, 2018 for more detail.)
Bitcoin is continuing to show signs of the next major Bull Run, which should see it reach new highs. Certainly the declining dollar will assist this mission.
This updated chart below shows the first week of the New Year ending with a bang:
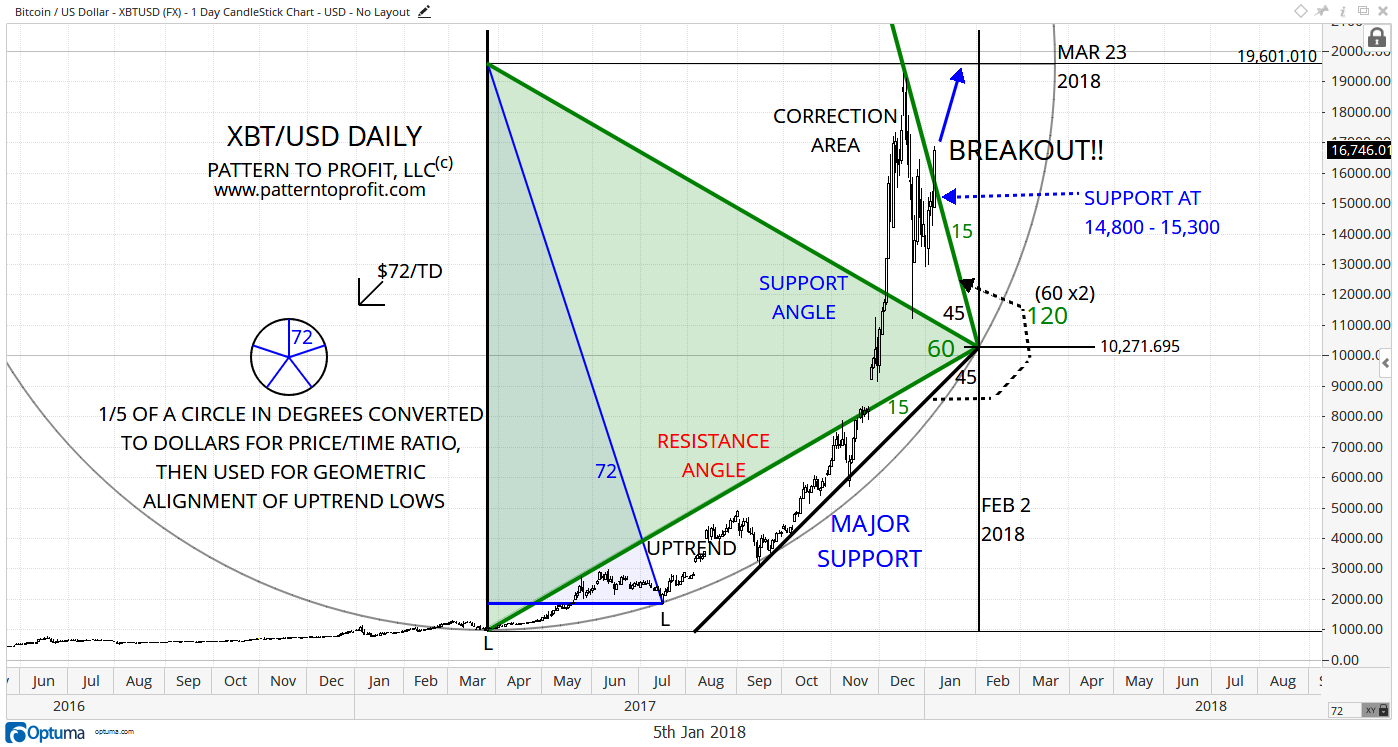
If circular support of $15,300 holds for this next week, especially with the week closing with a higher high, the likelihood of a continued bull run is very high. However, if the market falls back underneath this resistance line, then a drop to the center point of $10,271.70 by February 2, 2018 is expected.
The next chart has a similar set up, by finding a support circle for as many lows in the major uptrend as possible. Four lows sit on this circle; with the implication that a successful breakout of this circle is a call to action (notice the all-time high was a dramatic failure to escape):
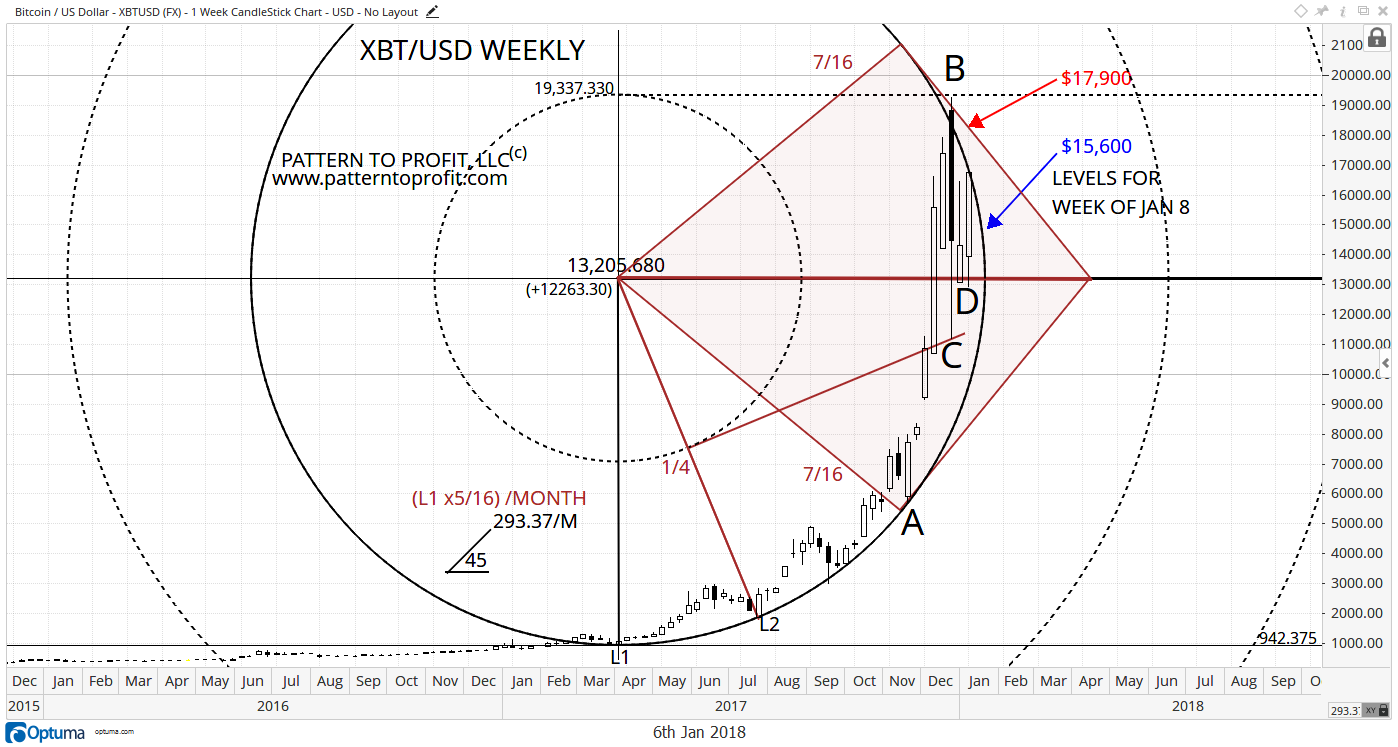
Last week’s resistance of $16,766.96 was highly effective, stopping the market almost dead in its tracks as it topped at $16,876.10.
This week’s circular support is $15,600, with the central level of $13,205.68 as a backup.
Upside resistance is offered first at $17,900, then $19,337.33 at the ½ circle top (horizontal black dashed).
Lastly, below is daily chart analysis that clarifies matters appropriately: solid support for the recent reversal to the upside, as well as a logical resistance level for the next potential major top, just a hair under $25,000.
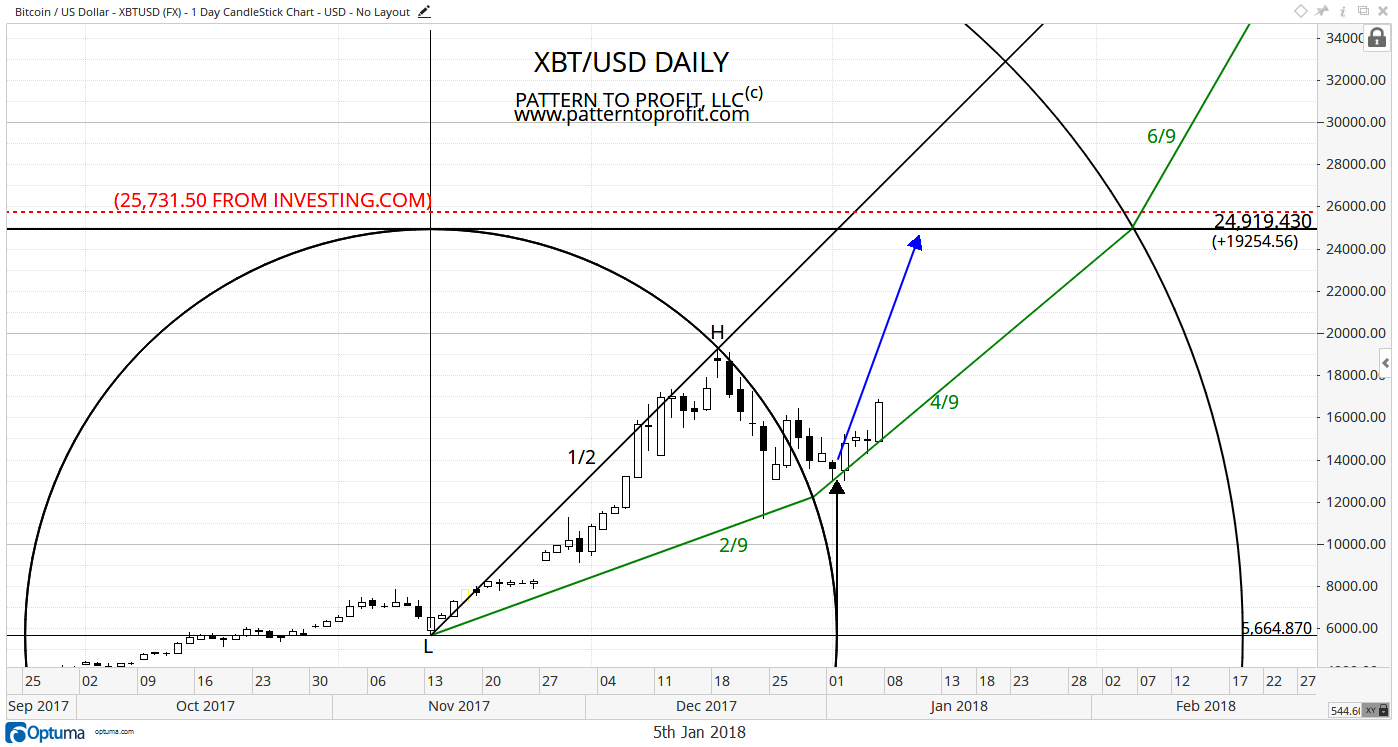
By aligning the preceding uptrend at 45o, all becomes clear:
- The lowest low of the correction is revealed by the circle’s right ‘corner’, or ‘due east’ (black arrow).
- That timing point’s corresponding price level is the top of the circle, or ‘due north’, at $24,919.43, a realistic target price.
- An ascending angle series, doubled in 9ths (2/9, 4/9, 6/9…) provides almost flawless support, and is continued forward for future potential support.
Disclosure: Pattern to Profit, LLC, any affiliates or employees or third party data provider, shall not have any liability for any loss sustained by anyone who has relied on the information ...
more

