
USD/JPY Reaches Low That Could Lead To Rally
Summary
- USD/JPY reached previous significant support zone and bounced intraday
- Potential reversal day forms on Friday as a bullish Hammer candle
- Similarity between time cycles where current decline matches prior fall in time
- Watch for daily close above Friday’s high for sign of strengthening
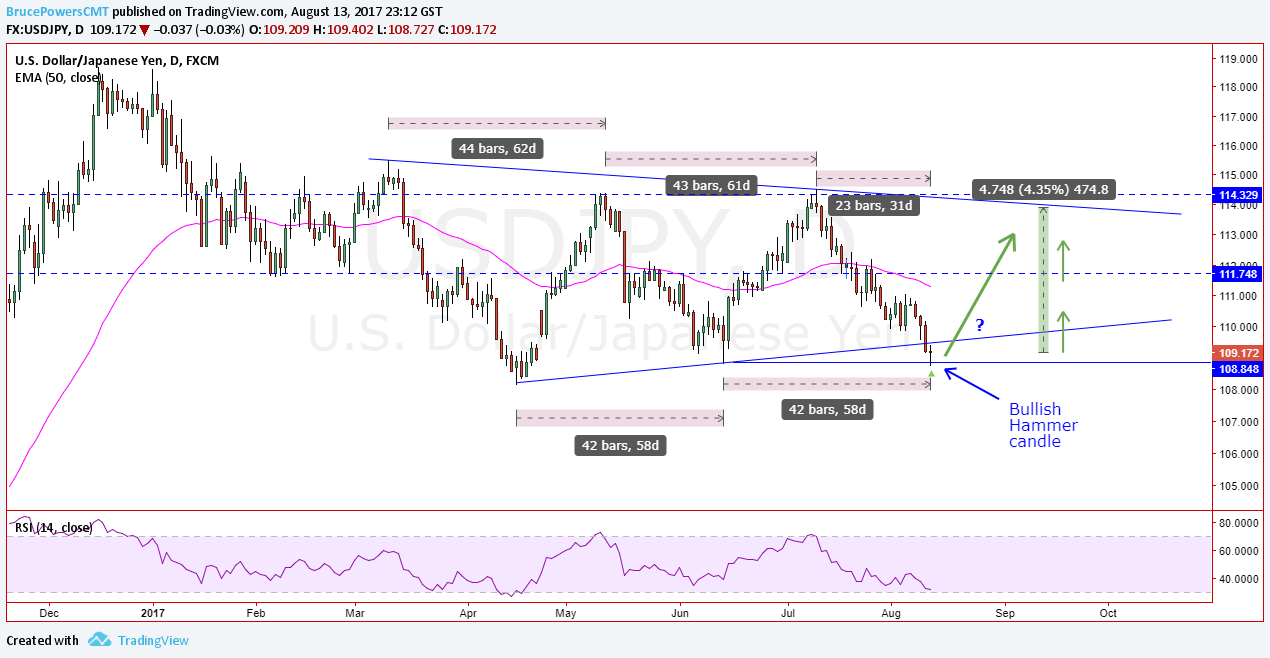
The USD/JPY reached a low of 1.0873 last Friday, right in the support zone that was hit at the most recent swing low of 108.80 from mid-June. By the end of the day a bullish reversal Hammer candle had formed in that support zone.
Time Cycles
What makes the current situation more interesting is that Friday completed 42 trading days from the 108.80 swing low thereby matching the previous swing low-to-low time cycle. Also, note the symmetry with the time cycles in the high-to-high swings. Each of the four cycles shown in the enclosed chart is from 42 to 44 trading days.
Forms a Symmetrical Triangle
Over the past several months the USD/JPY has been consolidating within a relatively wide range in the form of a symmetrical triangle pattern. Last week’s low busted through support of the uptrend line at the bottom of the pattern, which is a short-term bearish signal. However, if last week’s low holds and leads to a convincing bounce the triangle would have evolved or expanded with the uptrend line moved to connect to last week’s low.
Given the structure of the triangle and if a bullish signal is triggered an eventual move up towards the top of the pattern near the downtrend line can be anticipated. That’s over 400 pips away depending on when the line is reached (if it is reached).
Disclaimer: The views and opinions expressed here are solely those of the authors/contributors and do not necessarily reflect the views of more


