
USD/JPY Breaches A Big Zone Of Support: Is The Trump Trade Done?
Ever since Abenomics came into play, the Yen has been a favored vehicle amongst currency traders. Because when you have a Central Bank pushing a big monetary program into global markets, much as the Bank of Japan had done since 2012 (or the Fed in 2009, ECB in 2015, BoE post-Brexit); there’s a type of a prevailing bias to work with that can quite frankly make a currency trader’s job a bit more-simple. For about three years, that bias was towards Yen-weakness; much by the design by the Bank of Japan. But as Chinese markets began to recede in a troubling fashion in the summer of 2015 – risk aversion flows reversed that Yen weakness, and brought strength into the currency throughout the first half of 2016; with the Yen jumping-higher against the Dollar by as much as 17.6%.
But in July, USD/JPY ran down to a key support zone around the ¥100-handle, and spent much of the next two months hanging around this zone. On the night of the U.S. Presidential Election, USD/JPY set a low of 101.96 – and then the Trump Bump began to envelop global markets, driving weakness into the Yen as the Dollar priced-higher via the ‘reflation trade’. This was a veritable gift to the Bank of Japan after their ill-timed move to negative interest rates earlier in the year didn’t work out so well. But the ‘Trump Bump’ was largely beneficial for the Japanese economy as the Yen weakened by as much as 17.2% from those election night lows. Making matters more interesting for the continuation of this theme is the fact that Japan is one of the few major economies that the newly-installed administration has specifically singled-out as NOT being a currency manipulator. Germany, China or even the U.K. – they can’t quite say the same.
Since the start of 2017 we’ve seen a series of questions around the drivers that had previously fueled the Trump Bump. This brought a retracement into USD/JPY, but for the past month-and-a-half support has continually held-up the pair around the ¥112-handle. An 80-pip zone of support straddling that level offers a series of different support variants: Multiple Fibonacci retracement levels, a couple of different psychological levels and quite a few examples of prior price action support.
During yesterday’s session that support zone was breached in a big way.
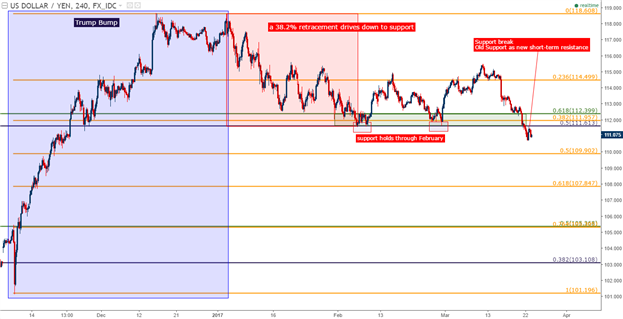
Chart prepared by James Stanley
At this point, short-term price action in USD/JPY is bearish as we’ve just seen resistance come-in at a prior level of support; combined with a ‘lower-high’ set below resistance.
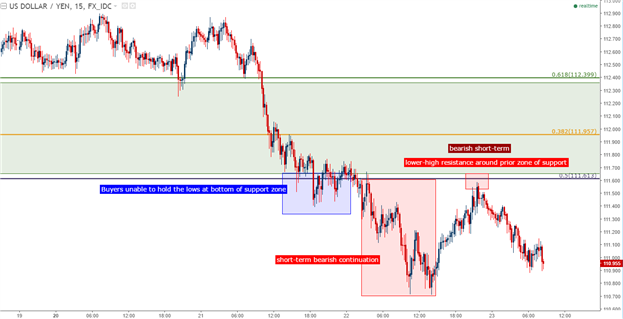
Chart prepared by James Stanley
But ~100 pips below current price action is another confluent zone of interest around ¥110.00. At ¥109.92 we have the 50% retracement of the Trump Bump: If price action poses a sustained-break below this level, then the prior bullish trend that began on the night of the Presidential Election would be nullified; and bearish, longer-term strategies will be favored. This would be an alignment of both short-term momentum and longer-term trend potential pointing in the same direction: Lower. But if this short-term momentum cannot carry price action below ¥110.00, the stage can be set for a bullish reversal of short-term momentum in the direction of the longer-term trend; which for trend-traders can be a really attractive type of setup given the risk-reward potential.
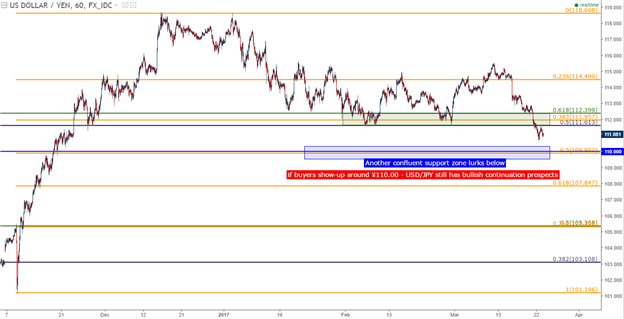
Chart prepared by James Stanley


