
MacParity Defined Undervaluations: 3.7%, 8.5%, 50.2%
Those are estimated amounts of currency undervaluation, using the Big Mac index and the Penn Effect as of July 2016. Guess which currency is 3.7%, and which currency is 50.2%.
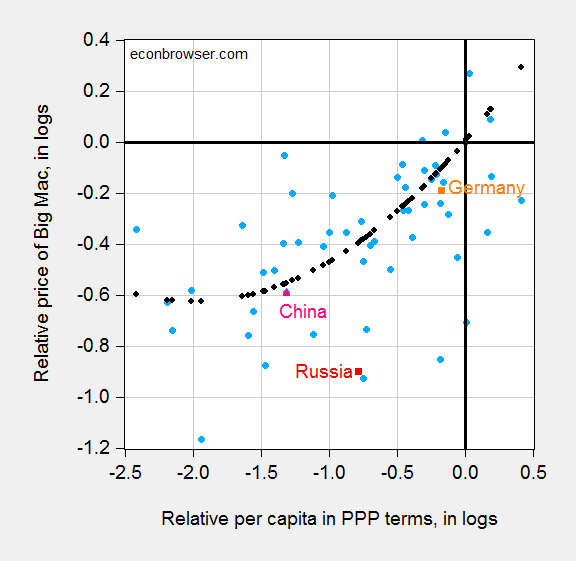
Figure 1: Log relative dollar price of Big Mac against dollar price of US Big Mac (July 2016) versus log relative per capita income in PPP terms (2016 estimates); regression fit from quadratic specification (black dots). Source: Economist, World Bank World Development Indicators, and author’s calculations. Data [XLSX]
50.2% undervaluation is Russia; 3.7% is China. 8.5% is Germany, the currency of which was highlighted by Peter Navarro. As shown in this post, the German estimate is well within the 90% prediction interval, while Russia (and Taiwan) are well outside the interval. Why isn’t the Administration threatening to impose trade sanctions on Russia (and Taiwan)? Not that I’m asking them to do it, but the selection of sanctions targets seem odd.
For a more formal examination of Chinese yuan undervaluation, see this paper; and for misalignment concepts in general, this post.
Disclosure: None.


