
Gold, Oil And G6 Targets For The Week Of October 22
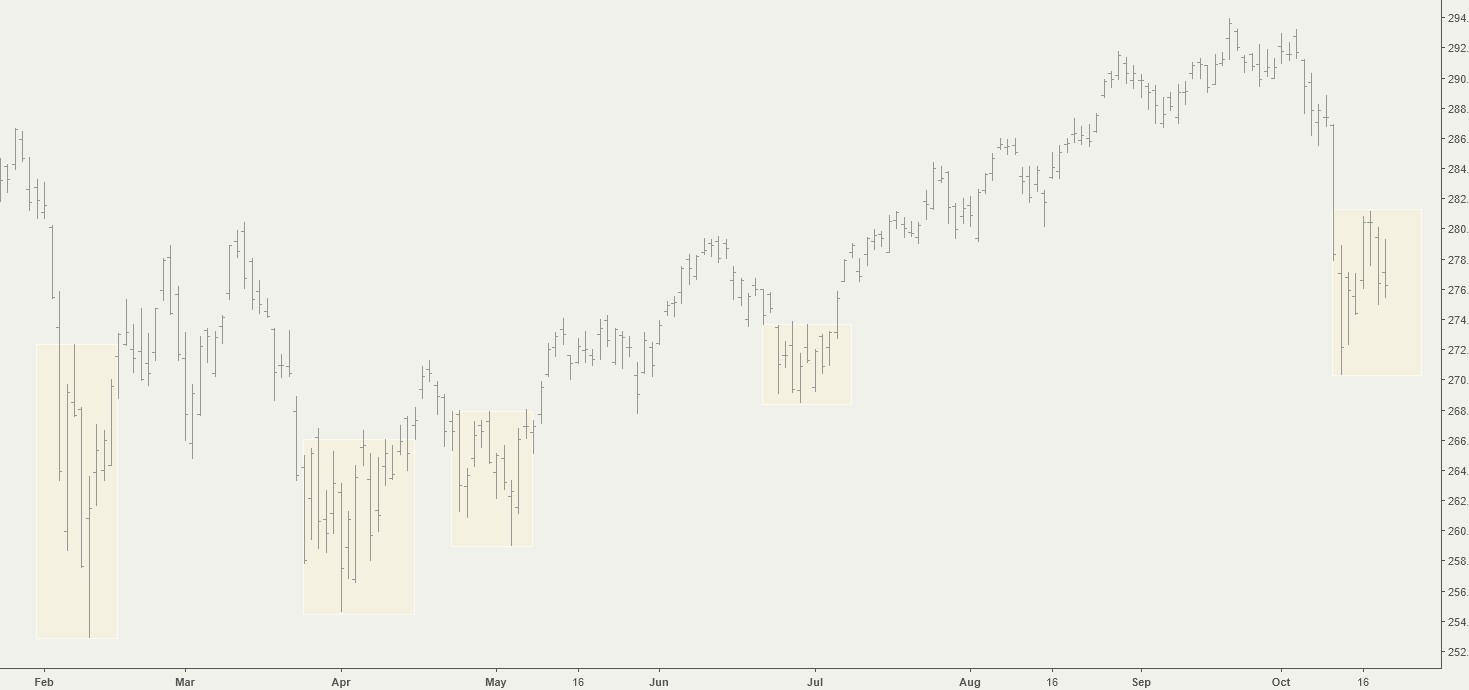
The SPX started the week strong and reached our upside target on Tuesday. However, it couldn’t hold onto the gains, reversed trend and finished the week flat. One thing to bear in mind is that during all sell-offs this year (February, April, May and June) the first swing low was followed by a lower low before the uptrend resumed:
Those who don’t like to wait for the appearance of automatically generated trading signals can keep on the right side of the market by incorporating pivot levels into their analysis. The CIT Pivot line (not to be confused with floor trader pivots) is a convenient tool for visualizing entry and exit points and for stop/loss placement. More importantly, these levels (along with the daily, weekly and monthly targets), are known ahead of time and allow you to formulate your trading strategy in advance. It helps being proactive instead of reactive.
In the charts below the red and green horizontal lines are displayed at levels above/below which long/short entries should be considered.
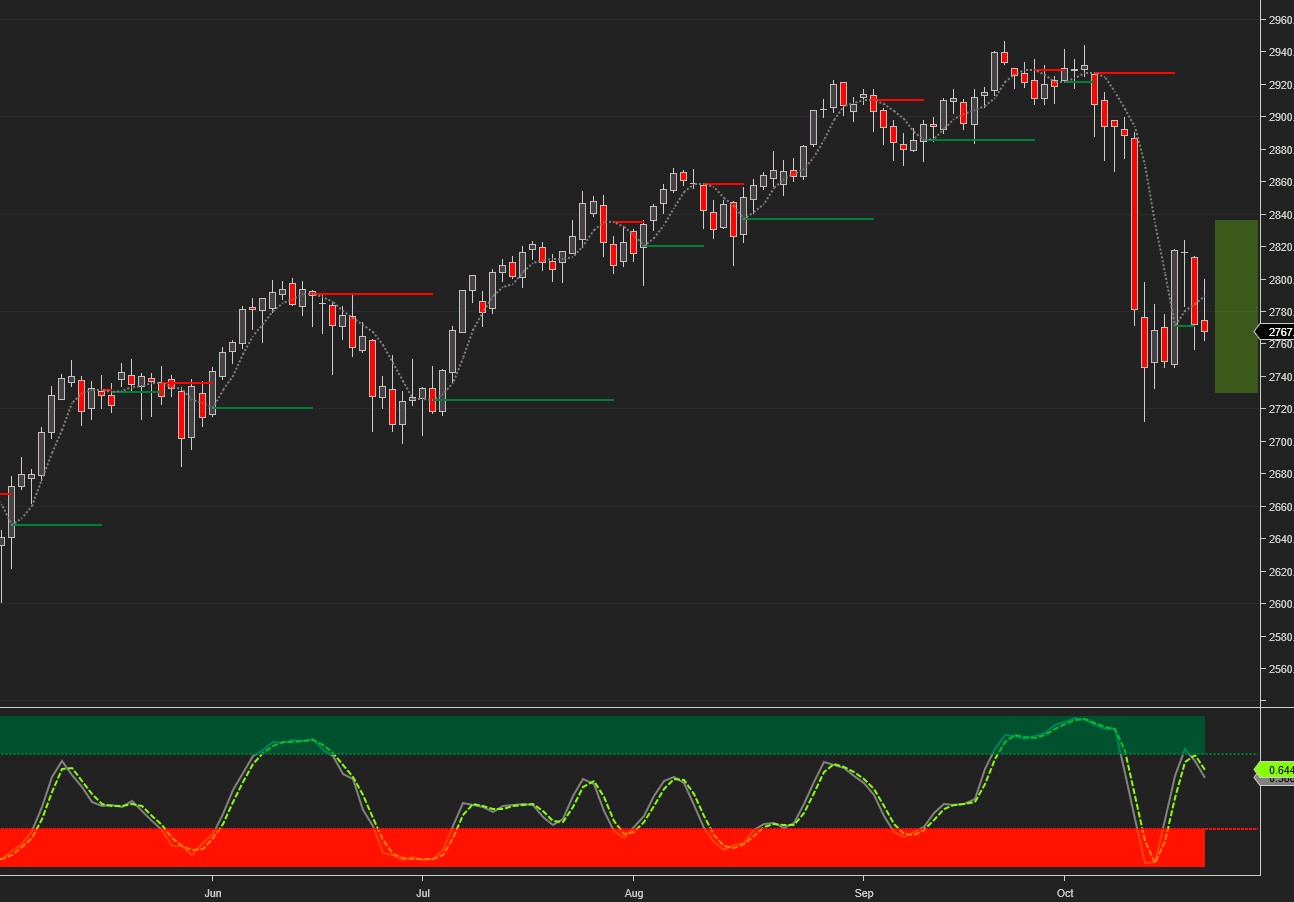
Current signals: Daily Sell, Weekly Sell, Monthly Sell
Monthly CIT pivot for SPX at 2916, S3 – 2735, R1 – 2953
The projected trading range for next week for SPX is 2730-2830:
Oil remained on a sell signal and reached our weekly downside target. It closed on Friday just 37 cents above it.
Current signals: Daily Sell, Weekly Sell.
Monthly pivot for Oil at 73.3, S1 – 71, R1 – 76
The projected trading range for oil for next week is 66.65 – 71.65:

Gold came to within $3 of our upside weekly target on Monday, but lost momentum and traded flat after that. It remains, however, above 1220 which is a key bullish reversal level.
Current signals: Daily Buy, Weekly Buy
Monthly pivot for Gold at 1196, S1 – 1172, R2 – 1240.
The projected trading range for gold for next week is 1210 – 1247:

Half of the G6 pairs hit their targets, the rest traded flat.
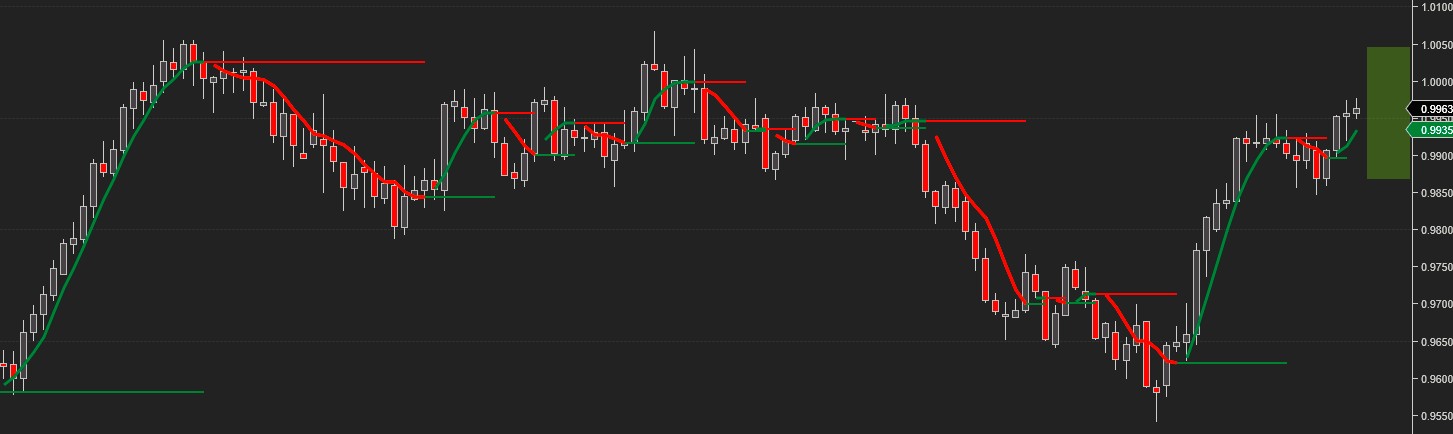
USDCHF showed weakness at the beginning of the week but recovered quickly and rallied to within a few pips of our upside target.
Current signals: Daily Buy, Weekly Buy
Monthly pivot for USDCHF at 0.981, S1 – 0.97, R1 – 0.993
The projected trading range for USDCHF for next week is 0.986 – 1.004:
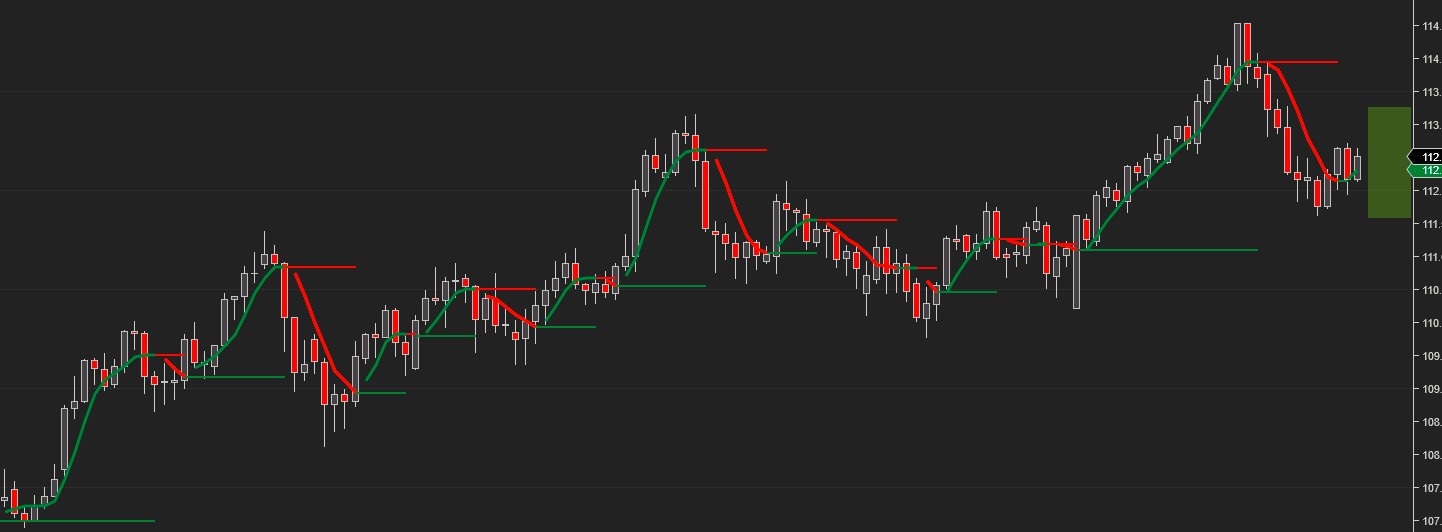
USDJPY traded all week long around the weekly pivot at 112.136. In the end, it managed to finish the week with a small gain.
Current signals: Daily Buy, Weekly Buy/Hold
Monthly pivot for USDJPY at 113.7, S2 – 111, R1 –115.
The projected trading range for USDJPY for next week is 111.5 – 113.25:
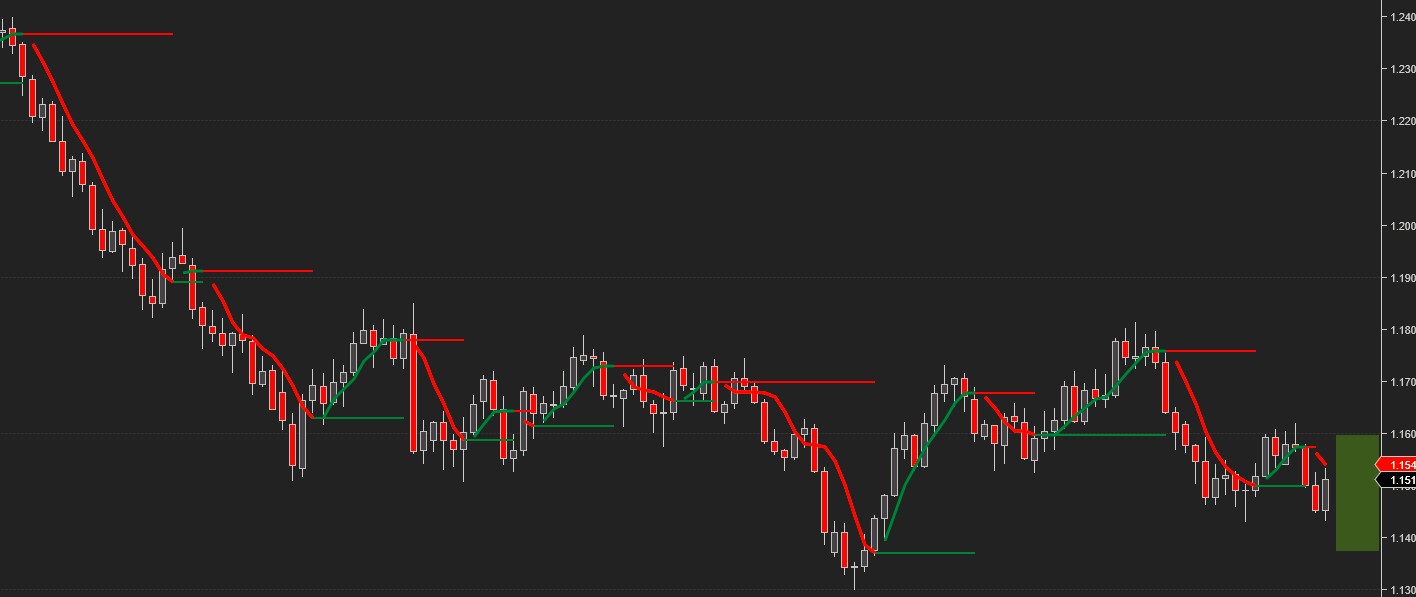
EURUSD remained on a Buy signal until Tuesday, then reversed and sold off to our downside target. Any further continuation of the hourly bullish swing which started on Friday is likely to trigger a daily Buy signal.
Current signals: Daily Sell/Hold, Weekly Sell
Monthly pivot for EURUSD at 1.1617, S1 – 1.147, R1 – 1.176
The projected trading range for EURUSD for next week is 1.137 – 1.16:
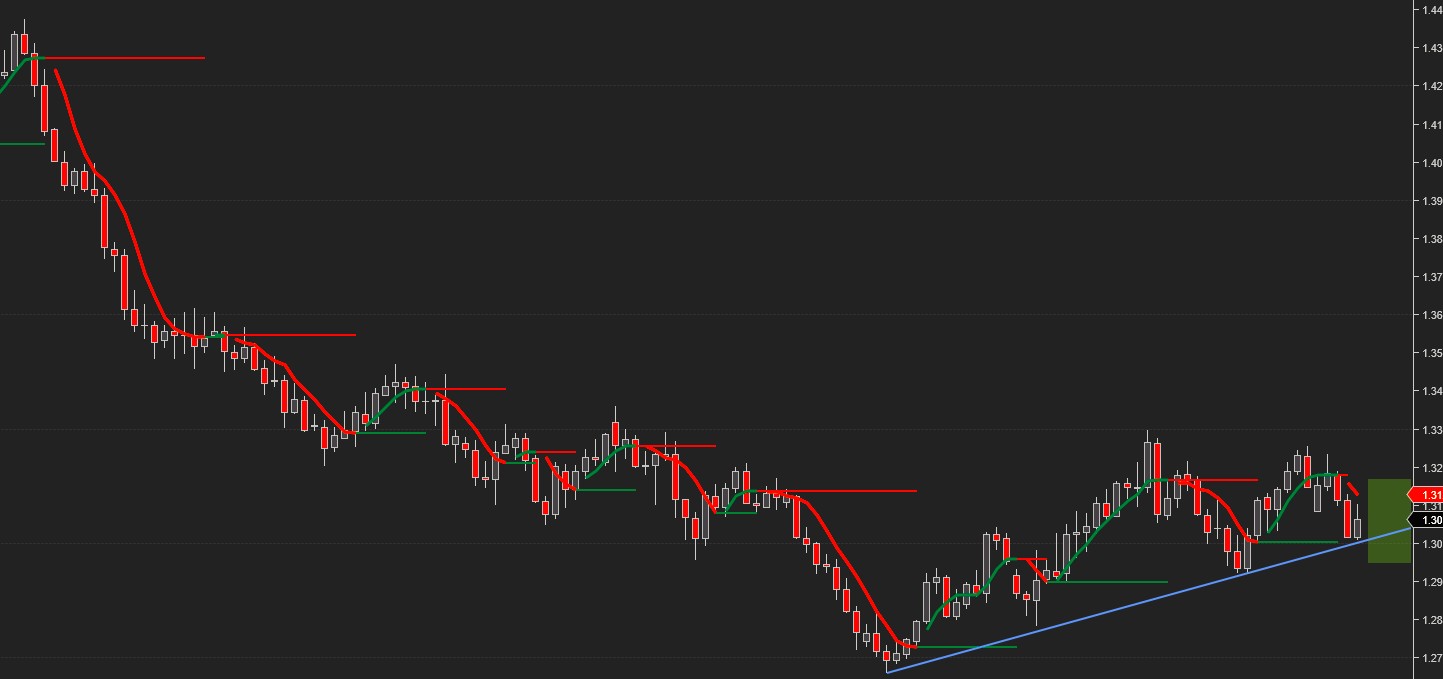
GBPUSD remained on a Sell Signal and closed on Friday on our downside weekly target. The low on Friday tagged the weekly uptrend line in place since August. Trading above that line is key for keeping the bullish weekly bias.
Current signals: Daily Sell, Weekly Buy/Hold
The monthly pivot line is at 1.302, S1 – 1.286, R2 – 1.338.
The projected trading range for GBPUSD for next week is 1.295 – 1.317:
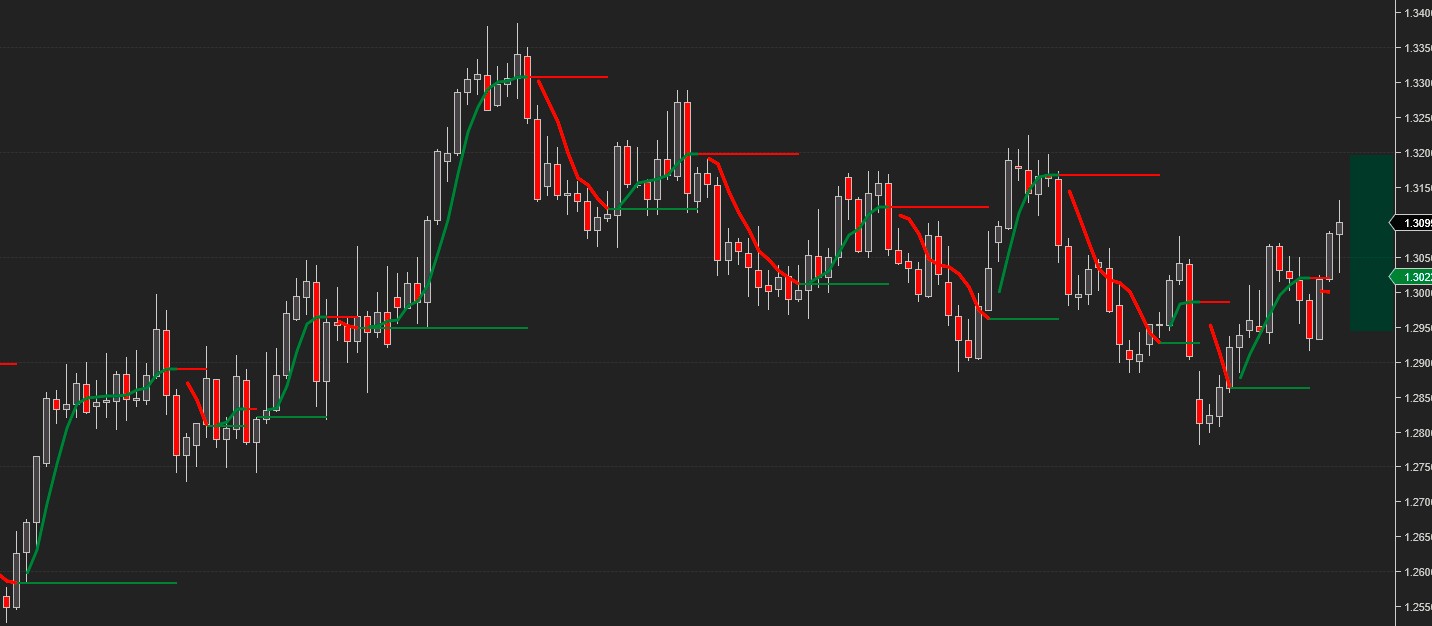
By reversing course mid-week USDCAD kept the bullish trend alive and reached our upside target on Friday.
Current signals: Daily Buy, Weekly Buy
Monthly pivot at 1.284, S1 – 1.27, R2 – 1.31
The projected trading range for USDCAD for next week is 1.295 – 1.32:
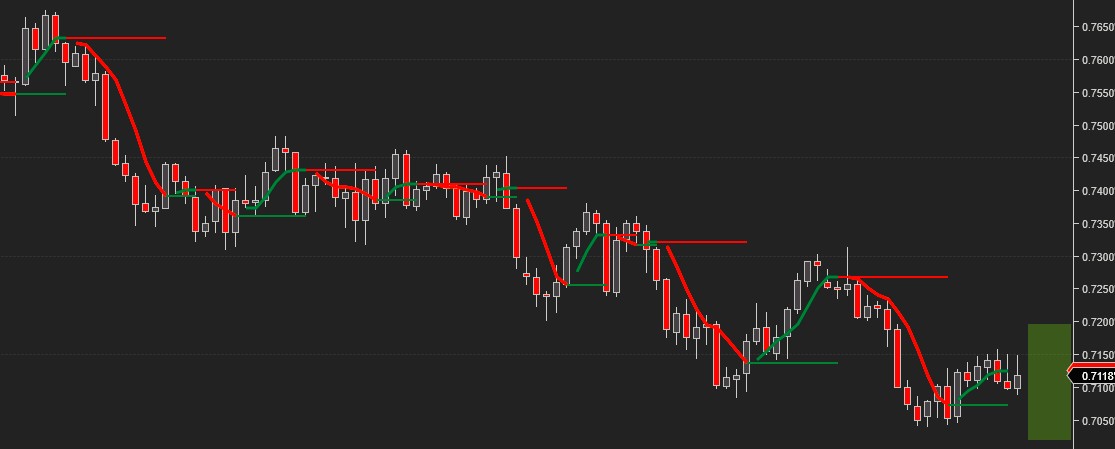
AUDUSD traded flat all week long, never challenging our targets which remain the same for next week. It needs to break above the weekly upside target at .72 for any show of strength.
Current signals: Daily Sell/Hold, Weekly Sell
Monthly pivot line at 0.722, S2 – 0.702, R1 – 0.733
The projected trading range for AUDUSD for next week is 0.7 – 0.72:
*Please note that the trading signals are in effect as of the close on Friday and may change as soon as the markets re-open. When the current signal is hold, we may also include the preceding buy or sell signal (e.g. Buy/Hold or Sell/Hold). Hold signals followed by a buy/sell signal in the direction of the preceding buy/sell signal can be considered for pyramiding the position.
Charts, signals and data courtesy of OddsTrader, CIT for TradingView and NinjaTrader 8
Disclaimer:Futures and forex trading contains substantial risk and is not for every investor. An investor could potentially lose all or more than the initial investment. Risk capital is money that ...
more

