
Gold & Dollar Index Outlook
Gold daily chart
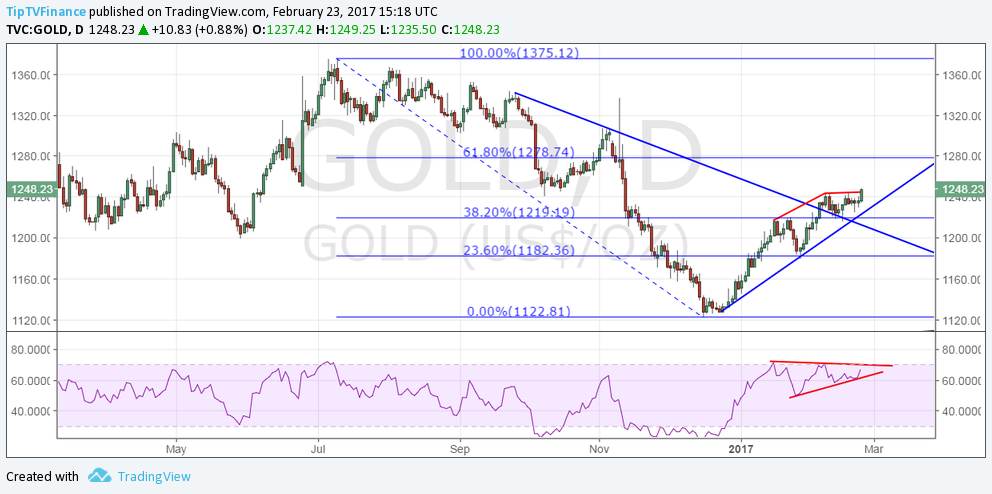
- Nice rebound from around $1219.19 followed by a close today above $1245 levels would open doors for $1270 (Apr 21, 2016 high) and possibly to $1278.74 (61.8% fib).
- Take note of the ascending triangle on the RSI. A bullish break would add credence to the bullish price action on the price chart.
Monthly chart
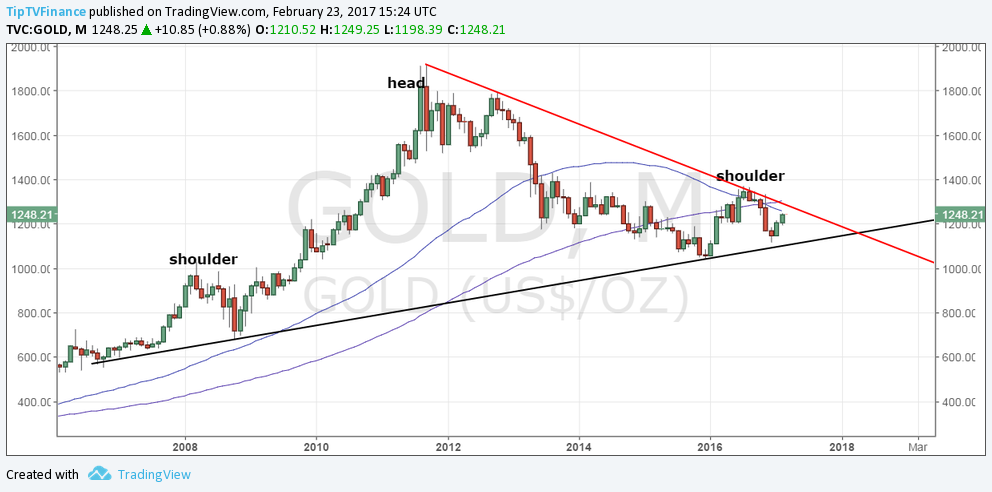
- 50-MA has topped out and is now sloping downwards. We also see a bearish 50-MA and 100-MA crossover.
- The descending trend line resistance is seen near $1300 levels.
- Bearish scenario: Failure at 50-MA level of $1261 followed by a drop below $1200 would signal the recovery from the December 2016 lows has topped out. Prices could then revisit $1122-1100 levels.
Dollar Index
Head & Shoulder pattern on the Dollar Index is another factor pointing to further gains in the yellow metal, given the inverse relationship between the two.
Daily chart
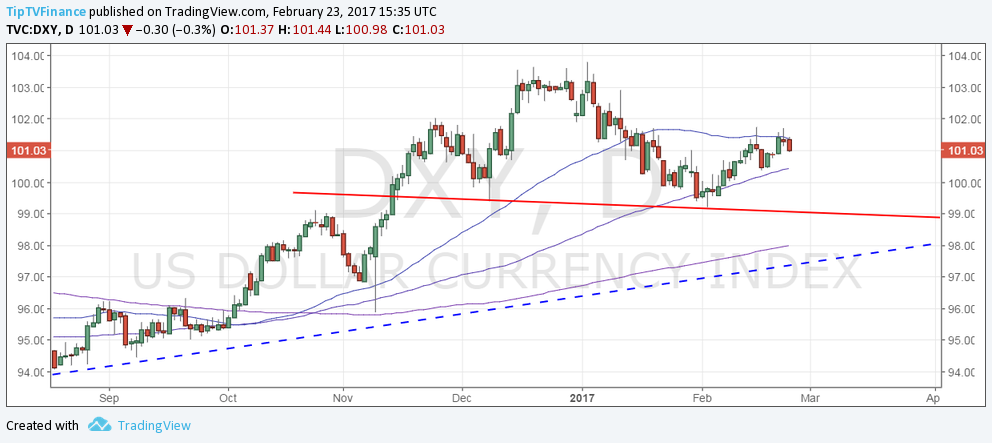
- The neckline support is seen around 99.10.
- The 50-DMA has topped out. More importantly, take note of the failure to hold above the 50-DMA on Feb 15 and Feb 22.
- The 100-DMA is still sloping upwards… which suggests the index could be restricted in the range of 100.00-102.00 in the next two weeks or so, before falling to neckline support.
- Note that a rebound from 100-DMA followed by a break above 102.05 (Nov 24 high) would signal bearish invalidation and would be an warning sign for the Gold bulls.
Disclosure: None.
How did you like this article? Let us know so we can better customize your reading experience.

Comments
Leave a comment to automatically be entered into
our contest to win a free Echo Show.

