
Global Yield Curve, Manufacturing, Services & Trade Growth Trends
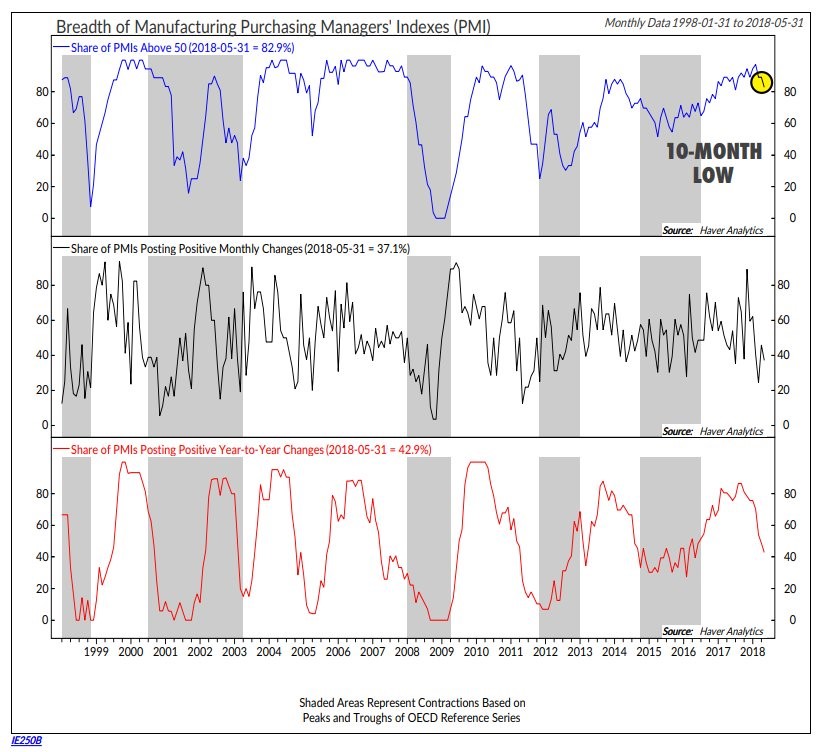
The latest trend in the global and domestic economic data is towards a decline in manufacturing, but an increase in services. Manufacturing is highly cyclical, with there having been 2.5 cycles of weakness within this economic business cycle if you count the current bout of weakness as half. The three charts from Haver Analytics show the situation in the global manufacturing economy.
(Click on image to enlarge)
Source: Haver Analytics
The share of PMIs that are above 50 is at a 10 month low. 82.9% of PMIs being above 50 is still good, but the recent peak was near prior peaks and the current rate of change looks terrible. The worst possible scenario to be in as an investor is when you are long an investment which has provided great returns has high future expectations, but the results are going from great to very good. As we mentioned earlier, there have been two other slowdowns which have occurred within this expansion and bull market. By definition, this slowdown is later in the cycle than the prior two. It is happening along with a flatter yield curve which is worrisome. By the time this next slowdown is at it’s worst, the curve has the potential to be inverted.
Don’t Worry About The Global Inversion Yet
As an aside, the global yield curve has inverted, but that’s because of the weighting of the index since the curves of every major country are normal. This weighting is manipulated by the fact that US debt has shorter maturity dates than the other major countries. The Fed rate hikes essentially are up against the low yielding European and Japanese long bonds. America represents 50% of the JP Morgan 1-3 year government bond index, but only 25% of the longer-dated 7-10 year bonds.
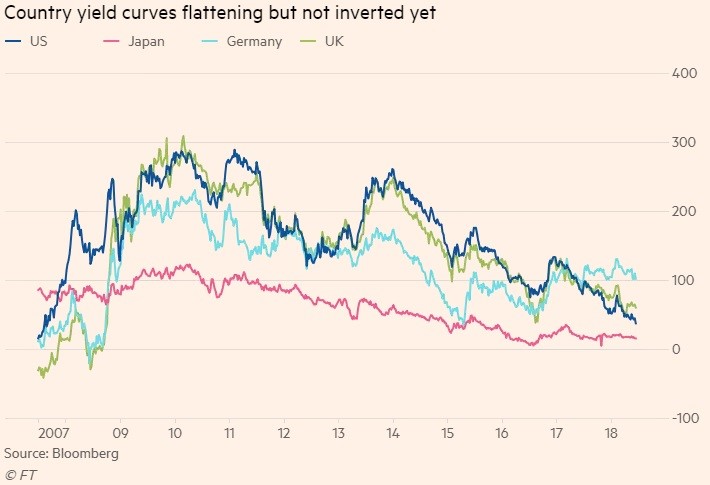
The Financial Times chart below shows the shape of each curve.
Source: Financial Times
The flatness of the US yield curve isn’t surprising when you consider how hawkish the Fed is in relation to the other central banks. The ECB and BOJ’s short-term rates are still negative.
Services Looking Good
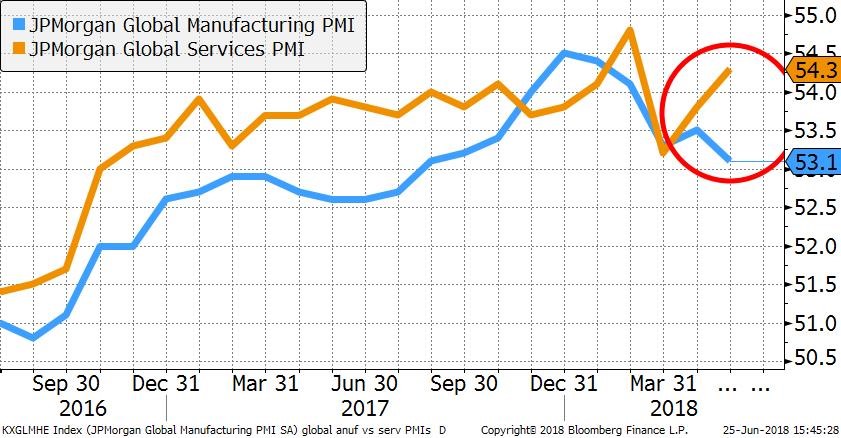
The Bloomberg chart below breaks down global PMIs by services and manufacturing.
(Click on image to enlarge)
Source: Bloomberg
The global manufacturing PMIs peaked in December 2017 while American manufacturing peaked in February 2018 according to the ISM PMI. To be clear, there’s not a defined date for this peak in US manufacturing because there are only suggestions of weakness in rate of change terms; it’s more likely manufacturing has peaked in the rest of the world. For example, the June Markit flash manufacturing PMI for Europe is at a 19 month low. The same index in America is at a 7 month low.
The chart also indicates the services index is improving. In the US, the Markit services PMI was 56.5 in June which was its 2nd highest reading since April 2015. For the US this is a good switch from manufacturing to services outperforming, unlike most countries, since the services sector was 66.1% of global GDP in 2016. In America, it was 78.9% of GDP as of 2015, which means the US is helped the most by this switch to services outperforming.
Are Tariffs Hurting Manufacturing?
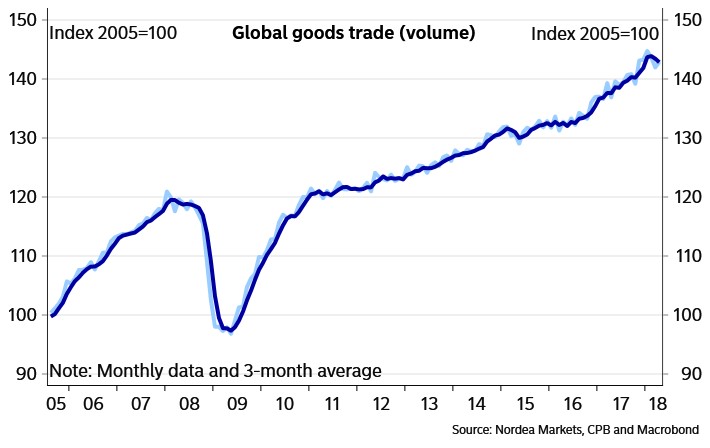
Manufacturing is much more integrated with global trade than services since manufacturing products require raw materials which are often produced in one country and exported to another while services like haircuts or finance are consumed where they are produced. This means manufacturing will feel the pain of a global trade slowdown. The volume of global trade is stagnating as you can see from the Macrobond chart below.
Source: Macrobond
Month over month global trade volumes were down 1.2% in March and up 0.7% in April. Year over year global trade volumes were up 4.4%. In comparison, American month over month trade volumes were down 0.7% in April and up 5.8% year over year. Since 2010, emerging markets in Asia and the US were the tied for first and the third fastest areas for trade volume growth. Emerging markets in Asia grew 34% and America grew 29%. This further contextualizes the trade skirmish between the US and China. The two global economic behemoths which have prospered from trade are debating tariffs, defense, and intellectual property rights. The result of this skirmish in the near term could be volatility in markets and a slowdown in global trade growth. However, if dialogue prevails and the sides reach an agreement this could eventually lead to freer trade (that could be a long shot expectation).
Chinese Weakness
It’s possible the latest trade growth data has shown weakness because of weakening in China rather than the trade war talks. There’s no question that a series of tit for tat tariffs will cause trade to slow. However, this effect was minor in April as the talks were mostly bluster rather than action.
China is undergoing an expected slowdown as its 6.9% GDP growth in 2017 is expected to fall to 6.5%. The latest data points support that notion; after the economy got off to a hot start in Q1 it has faltered. The fixed asset investment growth from January to May was 6.1% which was the slowest growth since February 1996. The May retail sales growth was 8.5% which was the slowest since June 2003. The growth in infrastructure spending was 9.4% in the first 5 months of the year, down from 12.4% from January to April.
Conclusion
There have been a few months of international data showing weakness in manufacturing. June Markit manufacturing PMI is showing some signs of weakness and the Philly Fed and the Empire State Indexes is showing signs of a deceleration. These indicators are all weakening along with global trade growth. The weakness is partially catalyzed by a decline in Chinese growth, but can intensify if the trade skirmishes turn into a trade war which is becoming more likely every day. The good news is the services sector is doing well both domestically and abroad. While the global yield curve has inverted, largely due to different weightings for the short and long bonds of various countries, this is not something to worry about yet because individual country yield curves have not inverted.
Disclaimer: Please familiarize yourself with our full disclaimer here.


