
EUR/USD Squeezed As Euro Recovers, But Can It Become Something More?
EURO RECOVERY, EUR/USD SHORT-SQUEEZE CONTINUES TO FRESH TWO-WEEK HIGHS
EUR/USD is continuing to recover losses from the prior May down-trend. As we looked at in the Tuesday webinar, EUR/USD had shown four consecutive days of resistance in a key zone of confluent resistance; and the longer that resistance held without bears being able to re-grasp control of the trend, the more likely a short-squeeze scenario would be. That squeeze came into play yesterday when prices broke above resistance, and now we have price action resisting in the second zone that we were looking at yesterday, between 1.1821-1.1855.
EUR/USD FOUR-HOUR CHART: BULLISH MOVE CONTINUES TO DEEPER RESISTANCE, TOWARDS 38.2%
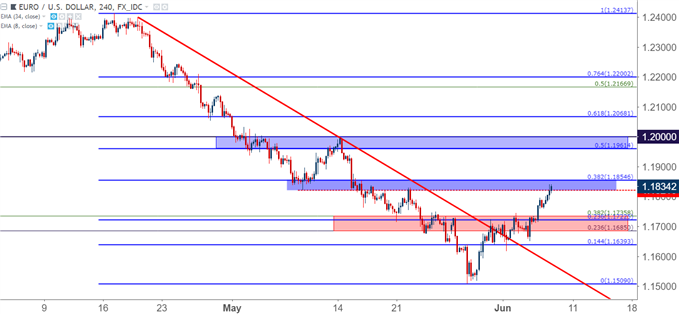
Chart prepared by James Stanley
At this stage, we could still call this a corrective move as we haven’t yet seen 38.2% of that prior trend erased; and the door could remain open for short-side strategies. But – given the backdrop with which this move has happened, and also taken with the fact that we have what’s looking to become an increasingly important ECB rate decision on the calendar for next Thursday, and this theme could continue to show influence; particularly if we see a continued downside move in the US Dollar (discussed later in this article).
EUR/USD DAILY CHART: DEEPER RESISTANCE POTENTIAL 1.1961-1.2000
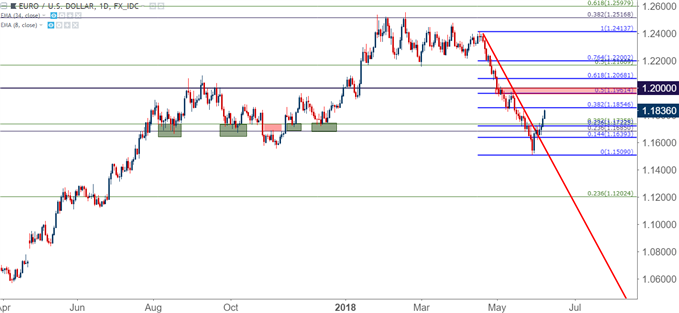
Chart prepared by James Stanley
The 50% retracement of the recent down-trend comes in at 1.1962, and just above that we have a prior swing-high around the key psychological level of 1.2000. This was the next zone of resistance that we looked at yesterday, and if prices can find the motivation to break back-above this area, then we could move forward with confidence that the bearish trend in May has flipped, and the door would remain open for a deeper bullish move targeting prior highs around 1.2500.
EUR/USD WEEKLY CHART: NON-COMPLETED MORNING STAR (BULLISH REVERSAL FORMATION)
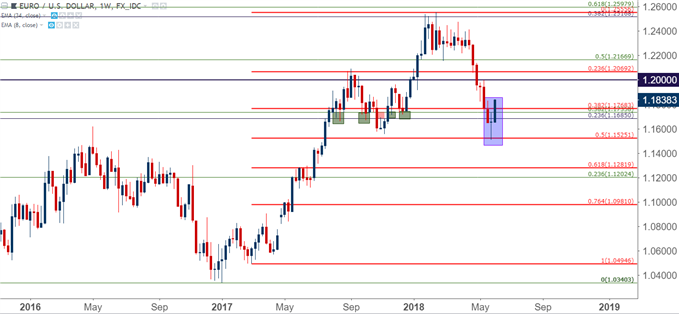
Chart prepared by James Stanley
US DOLLAR CORRECTION CONTINUES
Going along with that move of EUR/USD strength we have a deeper sell-off in the US Dollar. As we wrote yesterday, prices were starting to slip to fresh two-week lows, helping to reverse what had become an aggressively bullish up-trend last month. And this comes on the heels of last week’s weekly bar in DXYprinting a Doji at resistance, opening the door for potential reversal strategies.
US DOLLAR WEEKLY CHART: NON-COMPLETED EVENING STAR (BEARISH REVERSAL FORMATION)
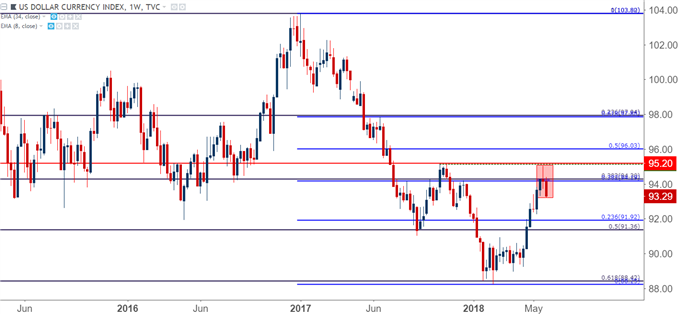
Chart prepared by James Stanley
Next week brings the June FOMC rate decision, and a hike at that meeting has been long expected. The argument can even be made that next week’s hike is currently priced-in to the Dollar after last month’s bullish run, and the question now is whether the bank is looking at an additional one or two hikes in 2018 (for a total of three or four hikes this year). This will be delivered via the dot plot matrix, and in our last read, the bank had an expectation for three hikes this year.
That was a bit messy, however, as one of the forecasts within the dot plot matrix had an erroneously low expectation, helping to drive down the average and giving the appearance of a more dovish Fed than what had actually taken place. In the month of May, continued strength in US data nudged-higher those bets for four rate hikes. And when this was combined with Euro-weakness on the back of an even more dovish ECB after their April rate decision, the US Dollar was finally able to break out of its 15-month slumber.
But that started to go awry after we saw volatility come into the equation around Italian politics. The thought being that the Fed wouldn’t be so aggressive as to impose four rate hikes in a year in which European political drama was taking center-stage. But, even as those rate expectations were going-lower, the Dollar continued to gain on the back of Euro-selling as driven by that political risk. Now that we have EUR/USD recovering, the Dollar his heading-lower and re-tracing a portion of that prior up-trend, putting the spotlight on next week’s FOMC rate decision as the next major directional cue in USD.
US DOLLAR VIA ‘DXY’ FOUR-HOUR CHART: GIVES UP SUPPORT AS SELLERS CONTINUE TO PUSH
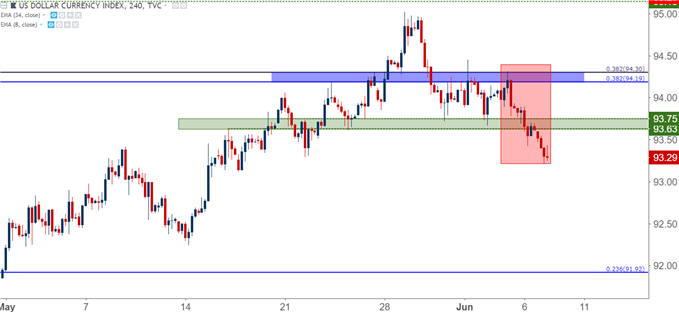
Chart prepared by James Stanley
GBP/USD: CABLE CONTINUES IN BEAR FLAG FORMATION
Brexit volatility has shown its face again in the British Pound, and this comes just ahead of a resistance test at a major zone around the 1.3500 level. This area from 1.3478-1.3500 was rather consistent support on the way down, and this level even has a bit of historical importance in the pair. Price action stopped short of testing that zone this morning, which is confluent with the 23.6% Fibonacci retracement of the prior bearish move.
The bear flag formation that we looked at on Monday remains, and this helps to keep the door open for short-side strategies. This also helps to highlight how GBP/USD may continue to be one of the more attractive candidates for long-USD plays as we approach next week’s FOMC rate decision.
GBP/USD FOUR-HOUR CHART: BEAR FLAG REMAINS
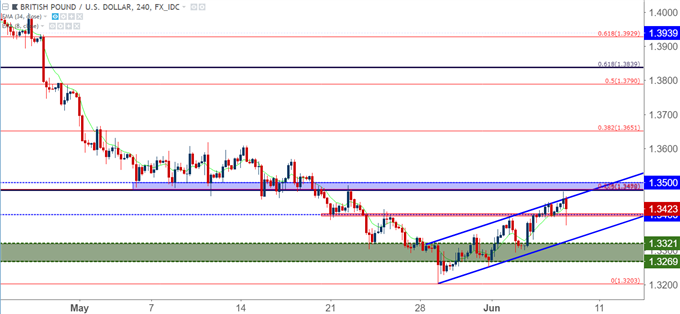
Chart prepared by James Stanley
Disclosure: Do you want to see how retail traders are currently trading the US Dollar? Check out our IG Client Sentiment ...
more

