
EUR/USD, GBP/USD Break Support Lines And Build Wave-4 Corrections
EUR/USD
4 hour
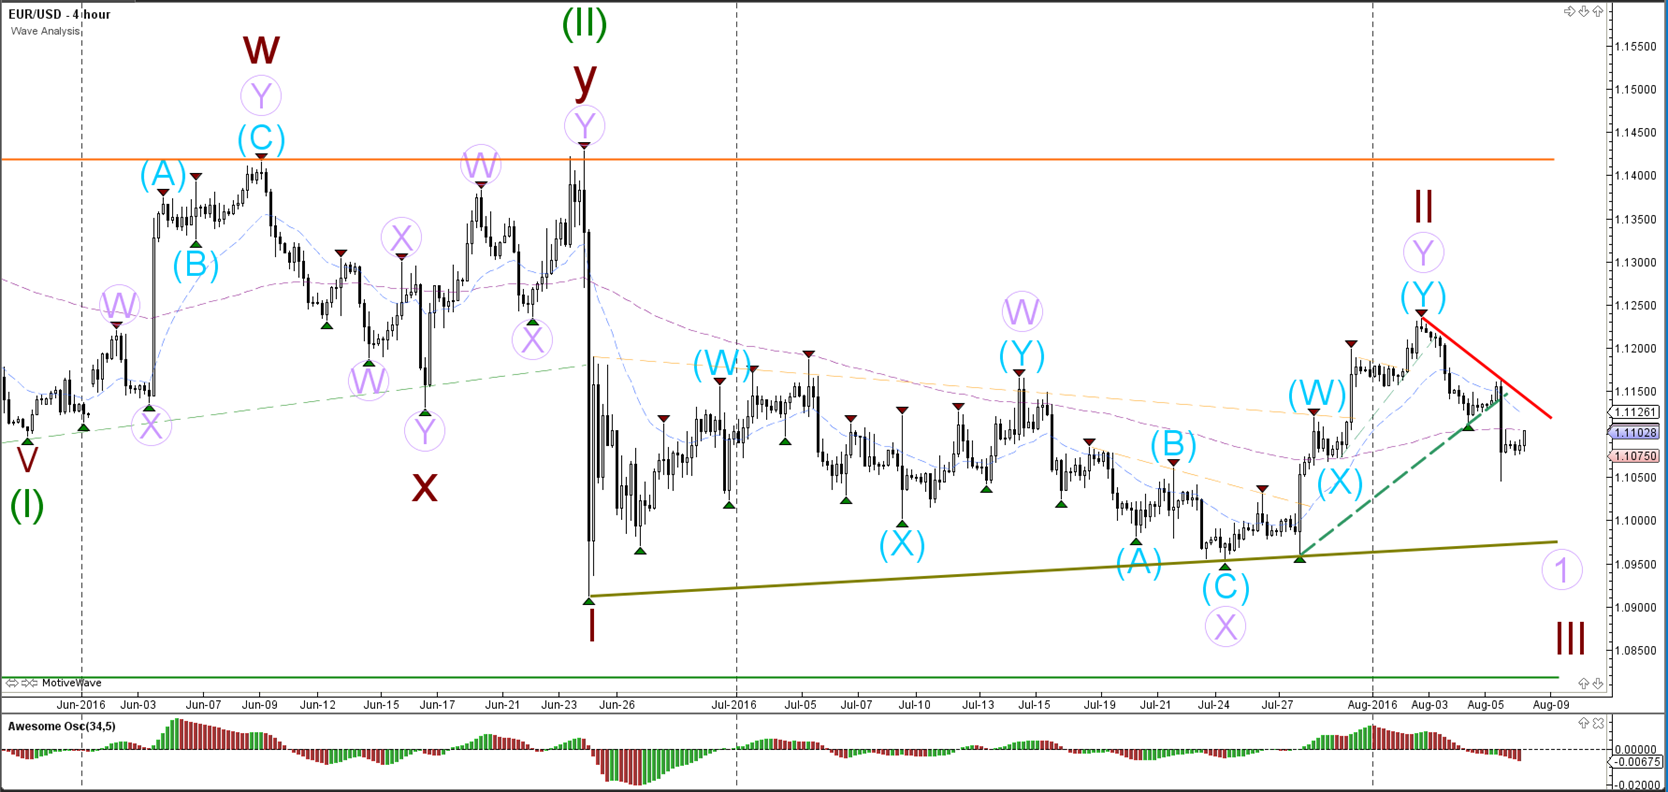
The EUR/USD seems to have completed a wave 2 (brown) correction but more bearish momentum is needed before this can be confirmed.
1 hour
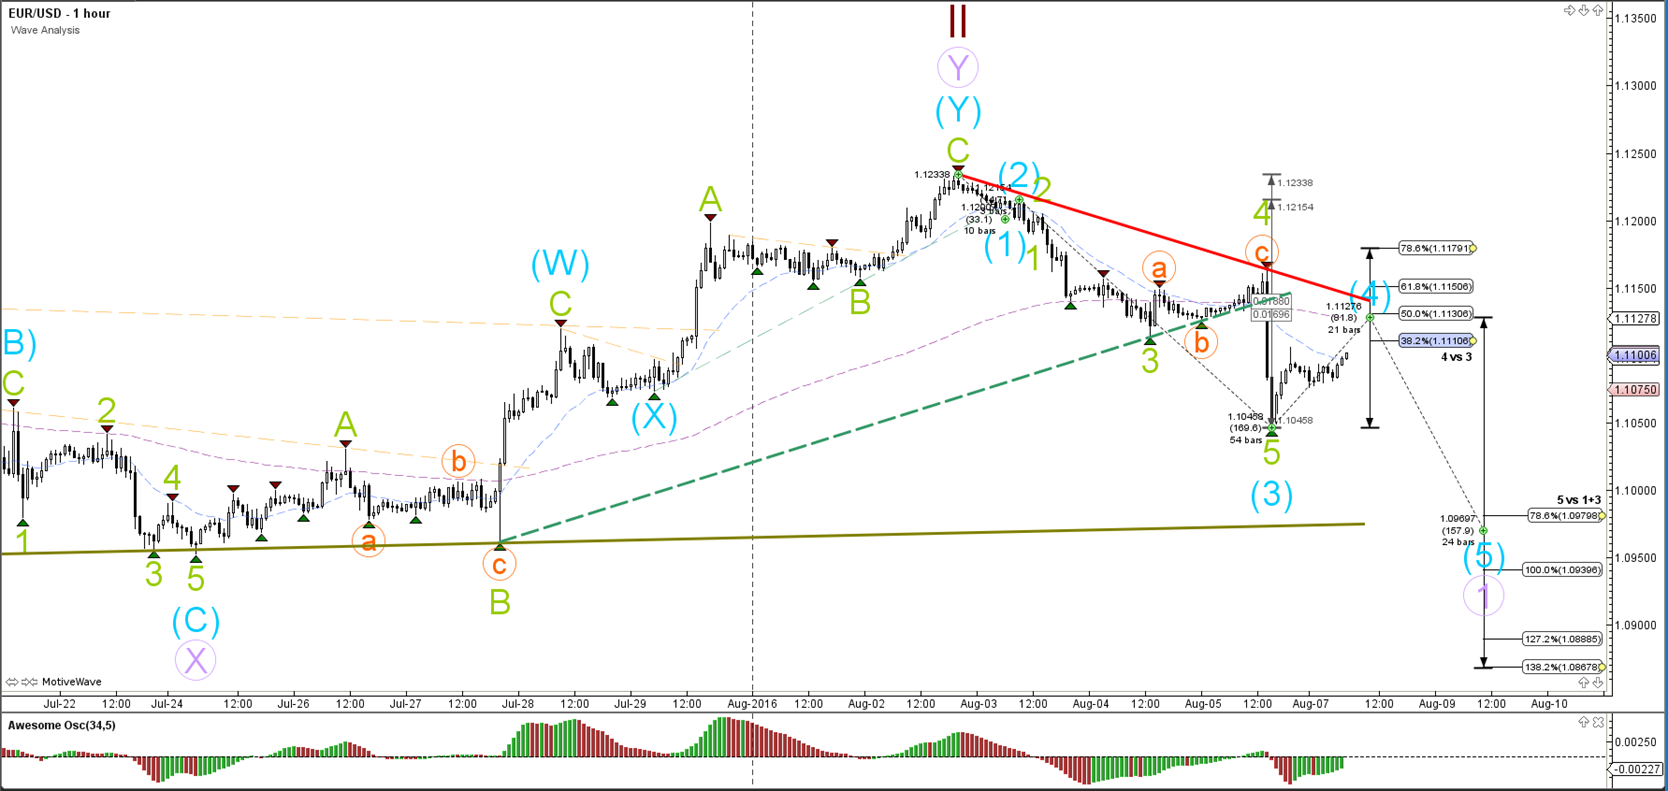
The EUR/USD broke the support trend line (dotted green), which completed wave 5 (green) of wave 3 (blue). The current pullback is expected to turn at shallow Fibonacci levels of wave 4 (blue).
GBP/USD
4 hour
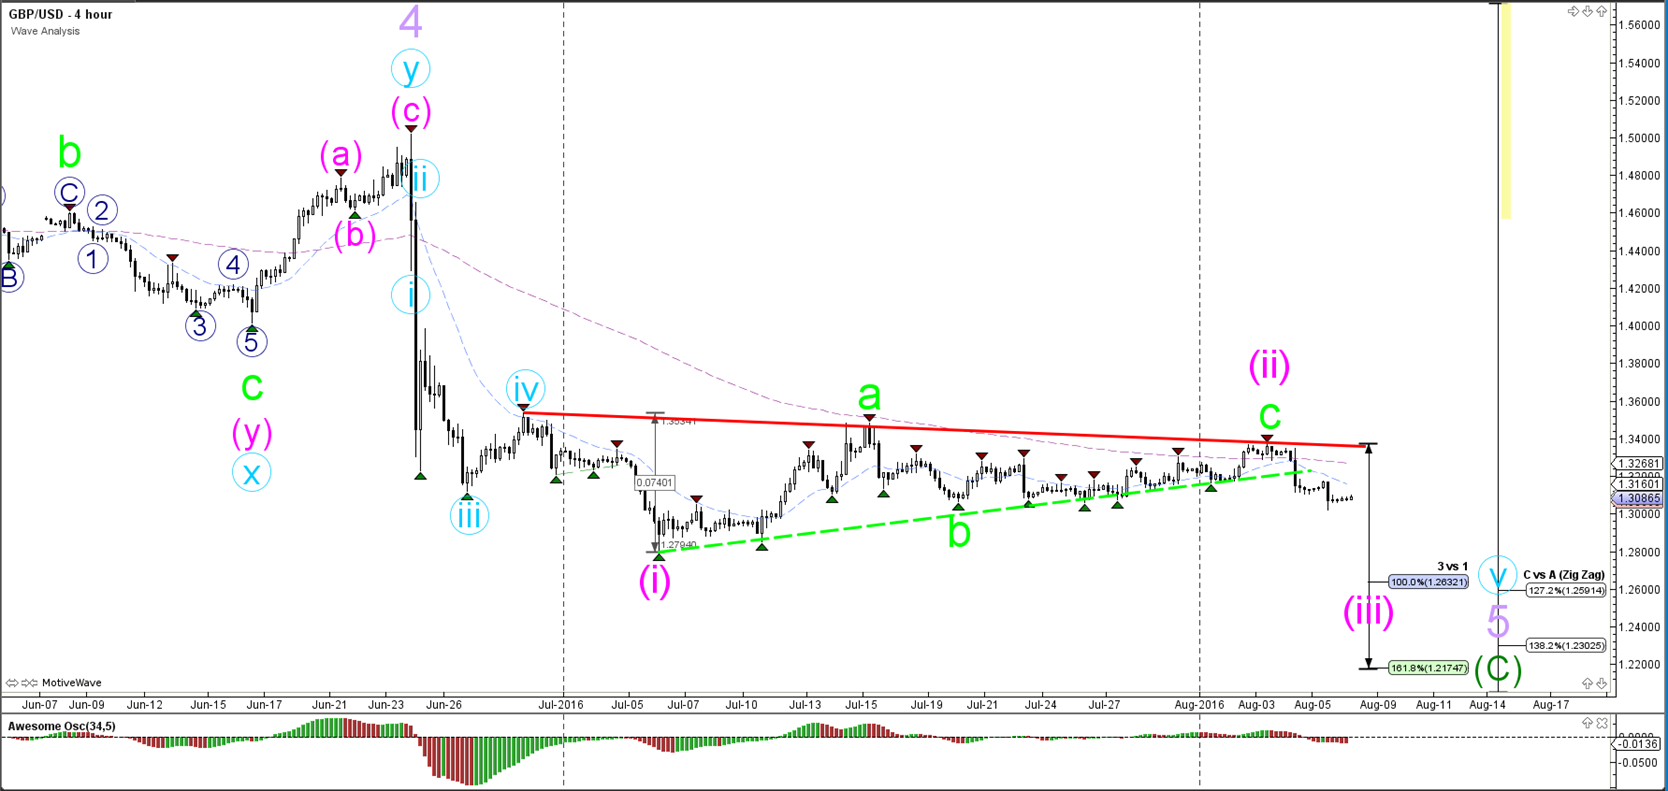
The GBP/USD keeps pushing lower with lower lows and lower highs. The bearish breakout is part of a wave 3 (pink) of wave 5 (blue) unless price breaks above the resistance line (red).
1 hour

The GBP/USD completed a wave 4 (grey) pullback as expected and then broke support levels (dotted green) to complete wave 5 (grey) of wave 3 (blue). The 4 (blue) retracement is expected to stop at shallow Fibonacci levels. A break above the 61.8% makes the current wave count unlikely.
USD/JPY
4 hour
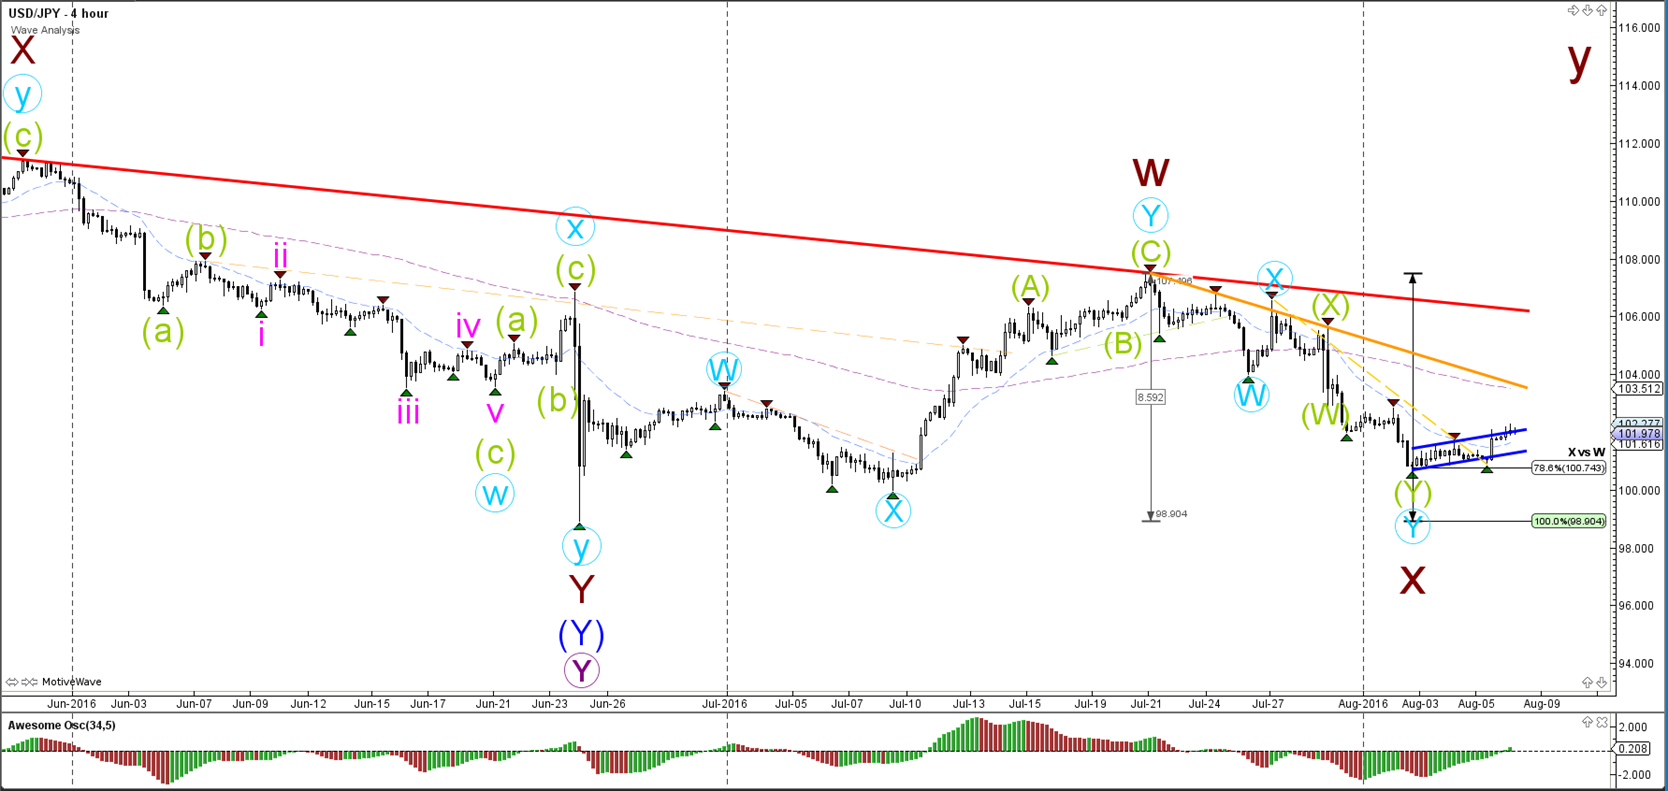
The USD/JPY is respecting the 78.6% Fibonacci level by building a bullish channel, which could indicate the completion of wave X (brown). A bullish break above the resistance trend lines (orange/red) would confirm a larger uptrend, whereas a bearish break could price fall further to test the 100% Fibonacci level.
1 hour
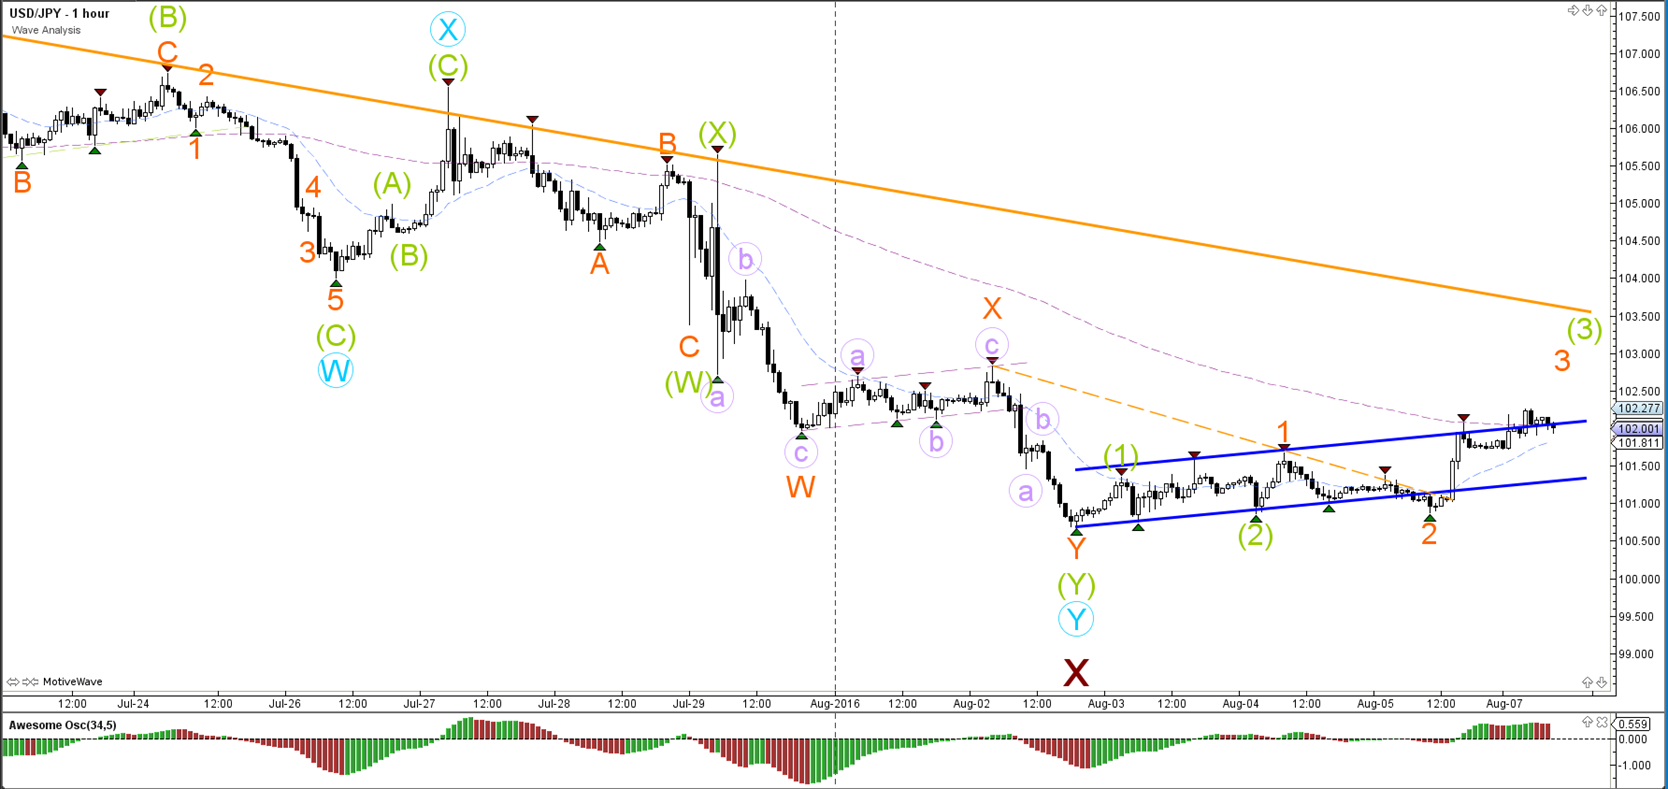
The USD/JPY has not been able to break above or below the channel (blue). The breakout direction will indicate the short-term trend.
Disclosure: Make sure to join this 2 part series if you are interested in the best price action approaches and ...
more

