
Euro, Yen And USD: Top Three FX Themes For This Week
The past few weeks have been loaded with economic drivers that have kept FX markets on the move. The economic docket for this week is considerably lighter, as we have but a handful of ‘high impact’ announcements on the calendar, and this can be an ideal time for traders to read price action in the effort of seeing where those next big themes might develop. Below, we look at three of the more pursing themes along with what traders might want to watch out for in the week ahead.
The U.S. Dollar: Strength to Stay or Will Buyers Stand at Bay?
Last week was the first that the U.S. Dollar didn’t lose value since the first week of July, and most of that movement came on the final day of the week after a solid NFP report squeezed USD-shorts. As we walk into this news-light week ahead, this is likely the theme that’s on the forefront of traders’ minds, as the jaw-dropping run of weakness in the U.S. Dollar so far this year hastened throughout the month of July and showed few signs of abating until Friday’s NFP report.
U.S. Dollar Daily Chart via ‘DXY’: Channel Support Test After a Brutal July
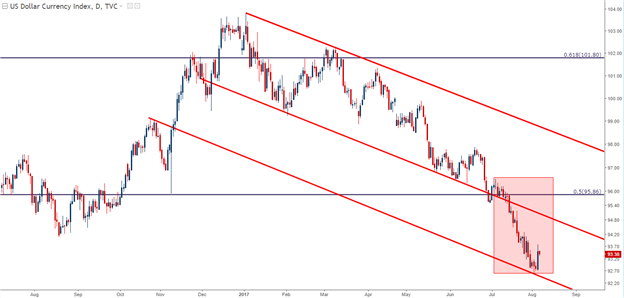
Chart prepared by James Stanley
From the weekly chart, we can see the Doji that printed last week after prices had breached the prior swing around the 93-handle. This was the final downside target in our Q3 forecast for the U.S. Dollar, and on the chart below, we can see how there was but one remaining swing from 2016 price action that has yet to be taken-out, and this resides at 91.92, which was the May, 2016 low.
U.S. Dollar Weekly Chart via ‘DXY’: Doji Prints after Breach of 93-handle
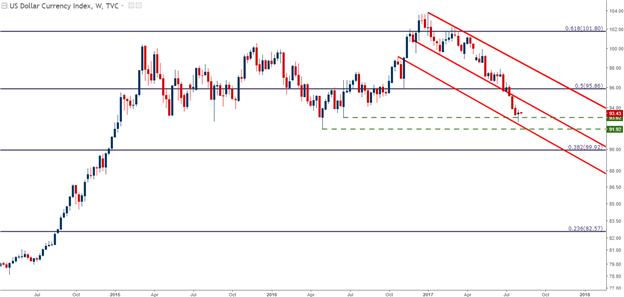
Chart prepared by James Stanley
The big question for FX markets as we move into this news-light calendar is whether or not Dollar bulls have more than a one-day showing. As we discussed last week, the Dollar had moved to extreme-oversold levels by a variety of metrics after the first seven months of the year saw more than 10% taken-out. This heavy short-side sentiment was likely a contributing factor to the pop in prices on Friday after a solid NFP report, but are we at a stage where diminished expectations for U.S. data are going to become easier to beat?
Given that we’ve had just one day of strength after a brutal seven months, traders will likely want to be patient when trading under the expectation of a prolonged move of strength in the U.S. Dollar. On the four-hour chart below, we look at three resistance zones that traders can watch for further development of this theme, as prices moving beyond these levels signal that bears may be taking a back seat to rising prices in USD.
U.S. Dollar Four-Hour Chart via ‘DXY’: Resistance Zones Applied
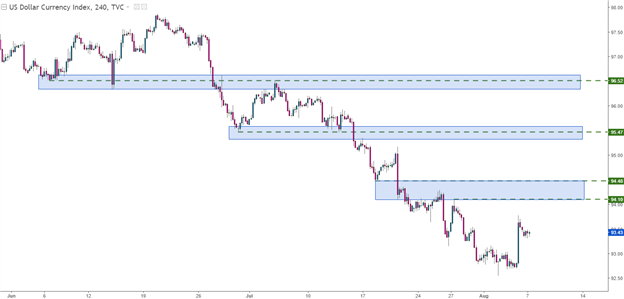
Chart prepared by James Stanley
EUR/USD: Has the Euro Topped?
On the other end of that move in the Dollar has been the bullish burst in the Euro so far this year. While the U.S. Dollar has languished, the single currency has thrived; and this has pretty much been driven by the opposite of what’s been seen in the United States this year.
As we came into 2017 with expectations for U.S. data relatively high, the bar for Europe was set extremely low. As U.S. data has been unable to keep pace with those elevated expectations, European data has had few problems coming-in with strength, and this has started to drive rate expectations in Europe higher while those in the United States have been dwindling-lower.
This has created a sharp move of strength in EUR/USD, as we can see below, with recent price action breaking above a confluent zone of resistance that rests between 1.1685-1.1736.
EUR/USD Daily: A Bullish 2017, Thus Far
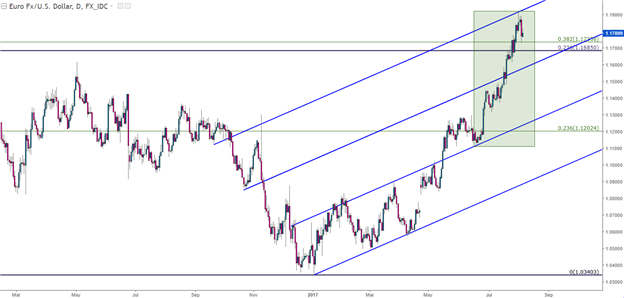
Chart prepared by James Stanley
From the above chart, we’ve outlined in Green the recent top-side burst in the pair. This move started in latter-June after EUR/USD put in ~a month of range-bound price action; but this is notable because this is the most recent legitimate support test that’s been seen in the pair of recent. Since then, it’s basically been a bee-line higher with buyers responding to each simple dip in the trend. While this is phenomenal for those that are holding long positions, it makes matters of re-entry considerably more difficult as it complicates risk management for trend-continuation approaches. So, the big question in EUR/USD for this week is where that ‘higher-low’ support might actually show up. On the four-hour chart below, we’ve applied a Fibonacci retracement to this most recent major move (in orange) in the effort of picking out spots where this might potentially show-up.
EUR/USD Four-Hour Chart: Potential Support Zones Applied
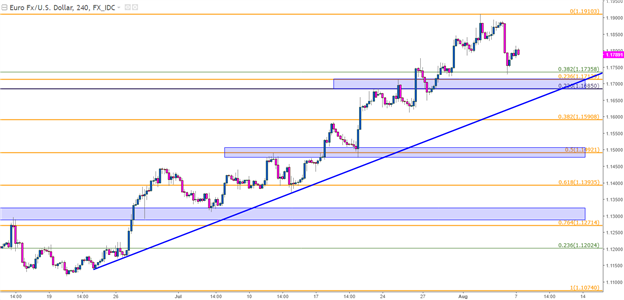
Chart prepared by James Stanley
USD/JPY: Is Support In Play?
If we are on the verge of a move of strength in the U.S. Dollar, few pairs would likely be as attractive as USD/JPY. After a massive move of strength to finish last year, USD/JPY spent the first few months of 2017 heading-lower. But since April, USD/JPY has been caught in a rather extended range with approximately 450-500 pips of distance between support and resistance. Key variables for this range can be found from a Fibonacci retracement applied to the ‘post-Election’ move in the pair: The 76.4% retracement of this move have helped to mark a ‘double top’ formation, as USD/JPY topped-out here in May and again in July.
USD/JPY Daily: Range-Bounce Since April
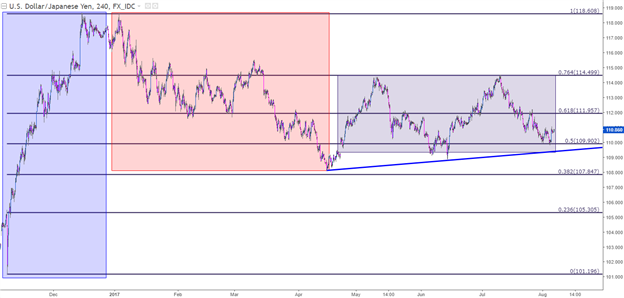
Chart prepared by James Stanley
Last week, the sell-off in USD/JPY continued all the way until the 50% retracement of that move came into play at 109.90. This is a confluent area, as that retracement is just ten pips away from the major psychological level of 110.00. But after multiple support tests at this zone, prices were able to burst-higher on the back of that NFP report, and after wiggling up to a slightly higher-high, buyers have come-in to show support at a ‘higher-low’. On the hourly chart below, we can see near-term price action gyrating over a descending trend-line as buyers attempt to bid USD/JPY higher.
USD/JPY Hourly: Near-Term Higher-High, Higher-Low
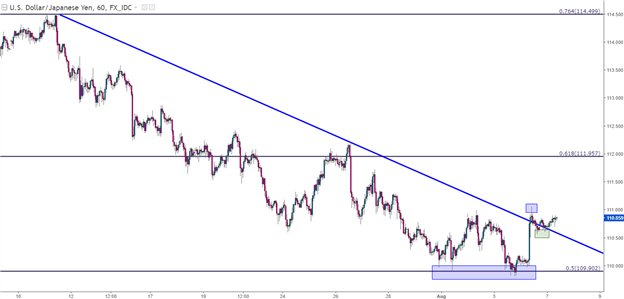
Chart prepared by James Stanley


