
October 2014 Consumer Credit Growth Continues To Slow, Growth Well Below Expectations
Consumer credit growth has been trending down down after peaking in July. Even with the backward revisions changing trends, this particular trend has been in play for two months now. In any event, year-over-year growth (ignoring student loans) is still growing at double the rate of consumer contribution to GDP growth.

The headline said:
In October, consumer credit increased at a seasonally adjusted annual rate of 5 percent. Revolving credit increased at an annual rate of 1-1/4 percent, while nonrevolving credit increased at an annual rate of 6-1/4 percent.
Econintersect's view:
Unadjusted Consumer Credit Outstanding
| Month- over- Month Growth | Year- over- Year Growth | Month- over- Month Growth without Student Loans | Year- over- Year Growth without Student Loans | |
| Total | -0.2% | +6.7% | -0.2% | +4.0% |
| Revolving | -0.2% | +3.2% | n/a | n/a |
| Non- Revolving | -0.1% | +8.0% | -0.2% | +4.4% |
Overall takeaways from this month’s data:
- Student loan growth has been decelerating gradually for the last 2 years;
- Student loans had little effect on Non-revolving credit growth as the data decelerated whether student loans were considered or not - and revolving credit (credit cards and has no student loans) has been slightly accelerating for the last 5 months;
- The backward revision this month as usual was significant enough to distort how one views the short term trends.
The market expected consumer credit to expand $12.0 to $20.0 billion (consensus = $16.8 billion) versus the seasonally adjusted headline expansion of $13.2 billion reported.
Note that this consumer credit data series does not include mortgages.
The Econintersect analysis is different than the Fed’s:
- an effort is made to segregate student loans from consumer credit to see the underlying dynamics;
- this analysis expresses growth as year-over-year change, not one month’s change being projected as an annual change – which creates a lot of volatility and distortion.
- where our analysis expresses the change as month-over-month, month-over-month change is determined by subtracting the previous month’s year-over-year improvement from the current month’s year-over-year improvement.
The commonality between the Fed and Econintersect analysis is that consumer credit is expanding whether one considers student loans or not. Econintersect does not believe the seasonal adjustment methods used in the headlines are accurately conveying the situation for a variety of reasons.
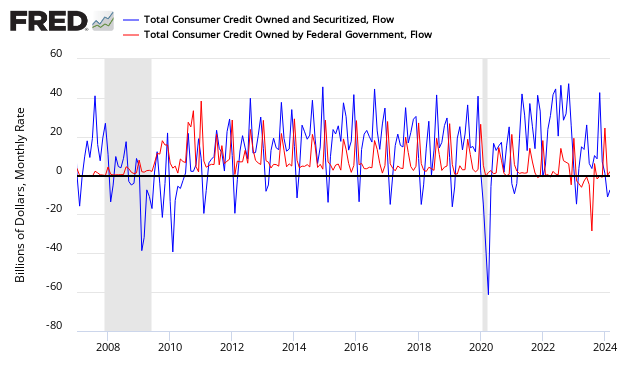
This month student loans accounted for 61% of the growth of total consumer credit. Since the Great Recession, much of the increase in consumer credit had been from student loans. The following graph shows the flow into consumer credit including student loans (blue line) against the flow into student loans alone (red line).
Flow of Funds into Consumer Credit – Total Consumer Credit (blue line) vs Student Loans (red line)
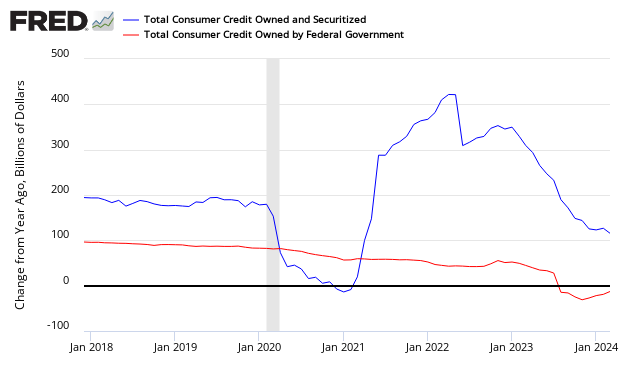
Another way to view the effects of student loans on consumer credit is to view the year-over-year growth in $ billions of student loans as a percent of total consumer credit (including student loans). In short, student loans accounted for all consumer credit growth from 2009 to late 2011. Currently, the growth of consumer credit (blue line in graph below) is showing growth.
Year-over-Year Growth in $ Billions – Total Consumer Credit (blue line) vs Student Loans (red line)
Consider that student loans make up a large portion of assets of the Federal Government [from Econintersect contributor Doug Short]

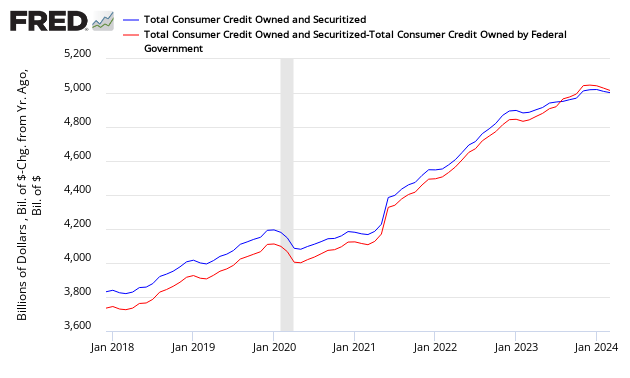
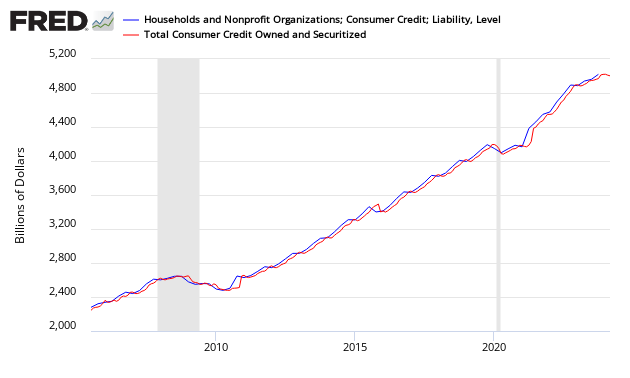
And one final look at total consumer credit and the effect of student loans. The graph below removes student loans from total consumer credit outstanding.
Total Consumer Credit Outstanding – Total Consumer Credit (blue line) vs Total Consumer Credit without Student Loans (red line)
Econintersect spends time on this generally ignored data series because the USA is a consumer driven economy. One New Normal phenomenon has been the consumer shift from a credit towards an electronic payment (current account debit) society – a quantum shift which changes the amount of consumption. Watching consumer credit provides confirmation that this New Normal shift continues.
Year-over-Year Growth of Consumer Credit – Total (blue line), Revolving Credit (red line), and Non-Revolving (green line which includes student loans)
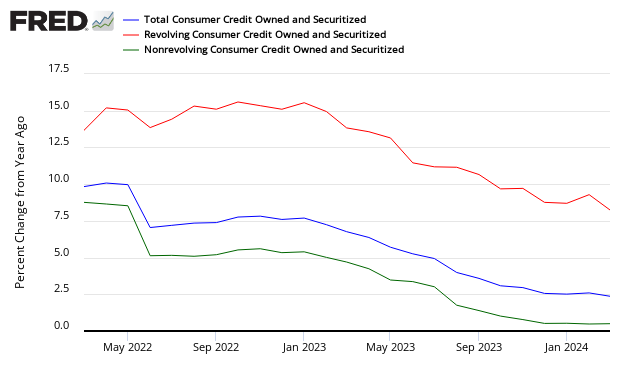
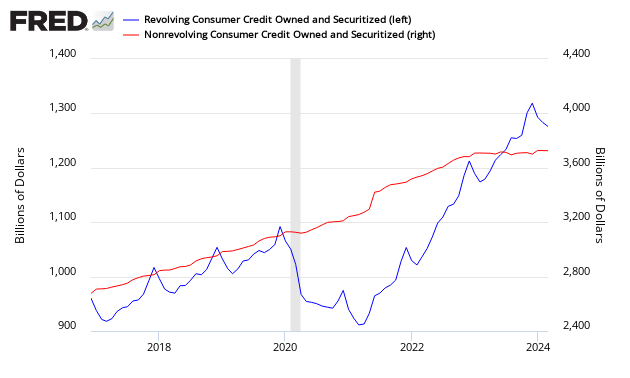
The Federal Reserve reports credit divided between revolving and non-revolving. The majority of revolving credit is from credit cards, while non-revolving credit includes automobile loans, student loans, and all other loans not included in revolving credit, such as loans for mobile homes, boats, trailers, or vacations.
Comparison Revolving Credit Total (blue line) to Non-Revolving Credit Total (red line)
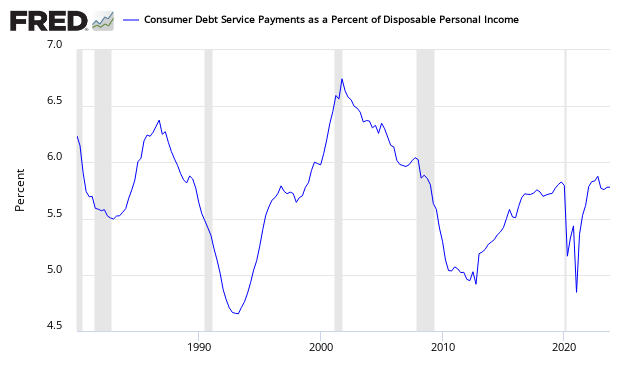
A Look at Consumer Ability to Repay Credit
The percent of consumer disposable income used to repay consumer loans (not including mortgages).
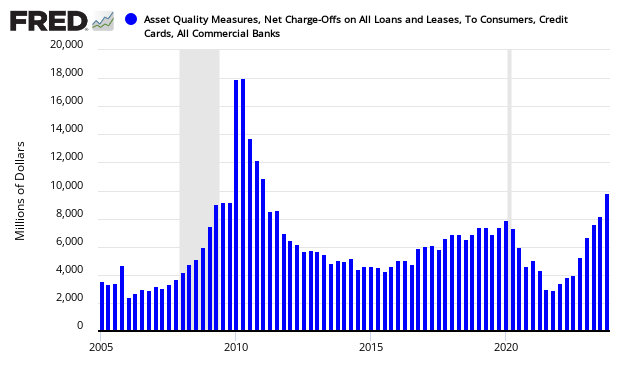
Other Consumer Credit Data from Outside this Report:
The question remains on the rate of write-downs of consumer loans. The following graph addresses this question:
Net Charge-Offs on Consumer Credit
The next graph addresses the question of loan losses by the banks which have returned to historical norms:
Bank Net Loan Losses – Percent of Total Loans

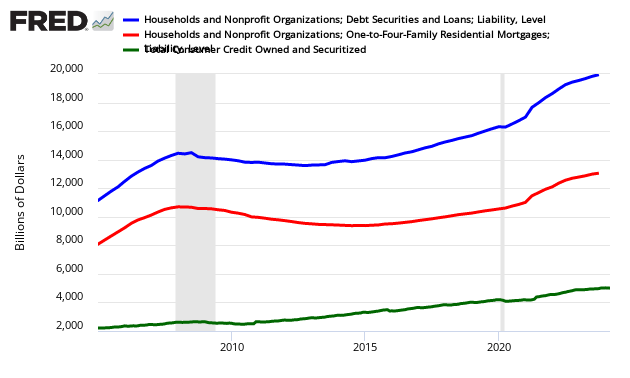
This consumer credit release does not include mortgages. Here is what total household debt looks like. Please note that the mortgage data is not as current as the consumer credit data in this post.
Total Household Debt (includes mortgages blue line), mortgages (red line), and Consumer Credit talked about in this post (green line)
And just to make sure the data in the consumer credit report migrates to other reports, here is a graph from Z.1 Flow of Funds.
Total Consumer Credit Outstanding from Flow of Funds Z.1
Caveats on the Use of Consumer Credit
This data series does not include mortgages, and is not inflation adjusted. This whole series has undergone a major revision with the April 2012 Press Release:
The Federal Reserve Board on Monday announced that it has restructured the G.19 statistical release, Consumer Credit, to reflect regulatory filing changes for U.S.-chartered depository institutions and, in addition to the data currently reported on level of credit outstanding, the release will now report data on the flow of credit. The revised data will be made available with the release of the April report on Thursday, June 7.
Savings institutions now file the same regulatory report as U.S.-chartered commercial banks. The U.S.-chartered commercial banks sector and the savings institution sector, which were previously shown separately, have been combined into a new sector called depository institutions. The previously published series for U.S.-chartered commercial banks and savings institutions will continue to be available as separate series in the Federal Reserve’s Data Download Program (DDP).
The new flow data represent changes in the level of credit due to economic and financial activity, rather than breaks in the data series due to changes in methodology, source data, and other technical aspects of the estimation that affect the level of credit. Access to flow data allows users to calculate a growth rate for consumer credit that excludes such breaks.
These changes will be accompanied by revisions to the estimates of outstanding consumer credit back to January 2006 and reflect improvements in methodology and a comprehensive review of the source data.
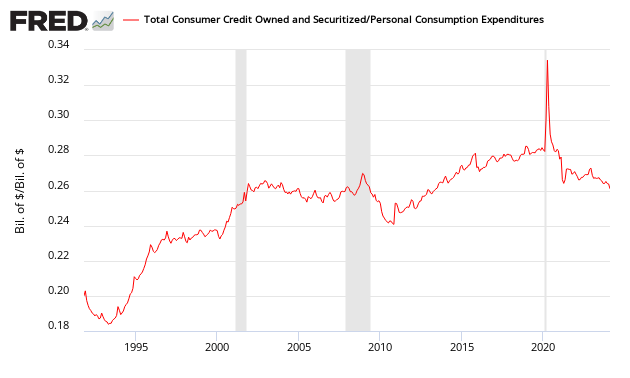
The graph below shows consumer credit outstanding (this data series does not include mortgages) is now above a high of over 26% in the 2000s, and well above the averages before the mid 1990s.
Ratio of Total Consumer Loans Outstanding to Consumer Spending
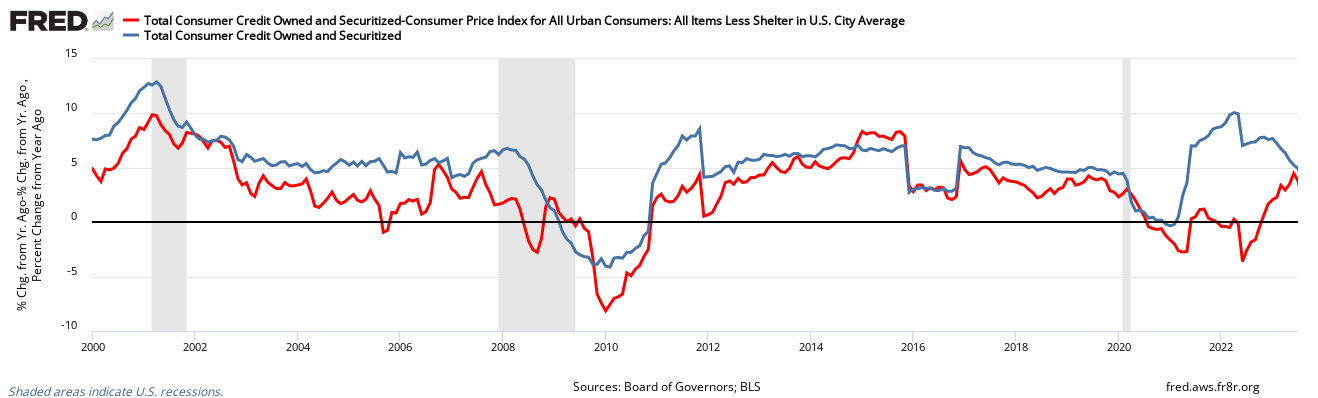
To get a feel of inflation adjusted consumer credit, the following graph is inflation adjusted consumer credit using the CPI-U (less shelter) – this is expressing consumer credit in 1982 dollars. It is evident on an inflation adjusted basis, consumer credit is beginning to grow.
Inflation Adjusted Consumer Credit
Also, an interesting graphic showing the consumer’s ratio of liquid assets to total liabilities – it is showing a rapidly expanding credit growth.
Ratio of Consumer Liquid Assets to Total Consumer Liabilities

Consumer credit is now fully recovered and may again be in the warning zone.
Disclosure: None.


Cheap gas means more Americans will drive their cars longer and farther. Environmentalists claim this will destroy the Earth's environment and cause catastrophic damage to society. Should the government raise taxes to keep gasoline prices high to discourage more consumption?